

If I could buy and hold forever, I would. But the market doesn’t work that way in my opinion. I think sometimes it pays to be a tactical investor.
As a case in point for today’s market, take a look at the cyclically-adjusted price-to-earnings ratio (CAPE), also called the CAPE ratio or the Shiller P/E after Yale professor Robert Shiller.
It’s been around at least since the heyday of Benjamin Graham in the 1930s, but Shiller popularized it (and gave its namesake) in the late 1990s.
Earnings Swing
The traditional P/E ratio values stocks by comparing current share prices to current-year earnings. The problem is that earnings can swing wildly from year to year. And disruptions like recessions or the COVID-19 pandemic only make things worse.
The CAPE ratio gets around that problem by comparing today’s stock prices to a 10-year average of earnings. This smooths out the ups and downs of the economic cycle.
Well, in looking at the CAPE on the S&P 500 below, stocks look expensive. That’s an understatement. They’re in nosebleed territory in my opinion.
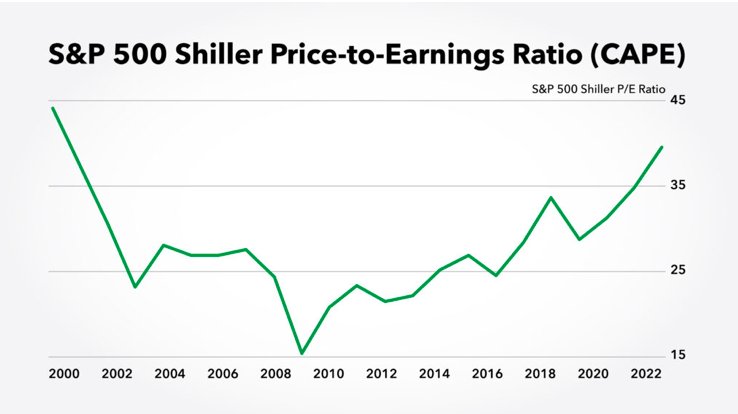
The CAPE today sits in the high 30s, which is right below the all-time peak set during the 1990s dot-com mania. What about Covid?
Remember, the CAPE ratio is specifically designed to smooth out the effects of disruptions like the pandemic. Stocks are that expensive — no ifs, ands or buts.
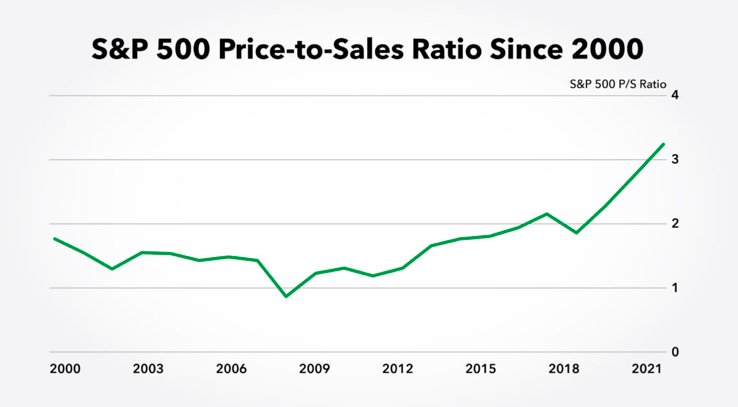
Now, let’s look at another popular metric, the price-to-sales (“P/S”) ratio.
Expensive Readings
Sales tend to fluctuate less than earnings, so the P/S ratio is an effective way to view the market’s valuation over time.
And it’s the same pattern here. The S&P 500’s P/S ratio is nearly double its 2000 level. That’s double the levels of what was, at the time, the biggest speculative bubble in history.
I could pick other metrics — dividend yield, price-to-cashflow, and so on — but you’re going to see the same result.
Bottom line: In my opinion, stocks are expensive.
This post first appeared on October 26 on the Money & Markets blog.
Photo Credit: Pictures of Money via Flickr Creative Commons
DISCLOSURE
This piece is provided as educational information only and is not intended to provide investment or other advice. This material is not to be construed as a recommendation or solicitation to buy or sell any security, financial product, instrument, or to participate in any particular trading strategy.
The Standard and Poor’s 500, or simply the S&P 500, is a stock market index tracking the performance of 500 large companies listed on stock exchanges in the United States. Investors can’t invest directly in indexes.
