

By Mark Barnes, PhD, head of investment research (Americas); Marlies van Boven, PhD, head of investment research (EMEA); and Christine Haggerty, research & analytics
Already off to a rocky start, the coming year promises to keep investors fixated on central-bank signals and the fight to contain Covid-19. We’d look to the power struggle between Value and Quality factors in the early stages of the post-lockdown recovery for clues on what may lie ahead.
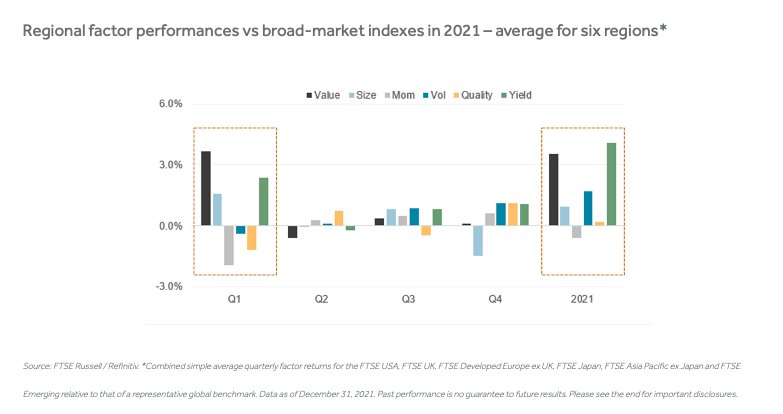
The chart below displays the average factor returns for six equity markets (i.e., the US, UK, Europe, Japan, Asia Pacific and Emerging) in each quarter of 2021.
The year began with a powerful rotation into riskier stocks, led by Value and other cyclically sensitive factors viewed as prime beneficiaries of a reflating economy, and away from pandemic winners of 2020, notably in Quality.
Market Turbulence
Although risk-off turbulence in subsequent quarters fueled rebounds in Quality and Low Vol factors, particularly in Q4, these defensive reversals were too meager to overturn Value and Yield’s outsized Q1 gains and full-year leadership.
Bond Yields
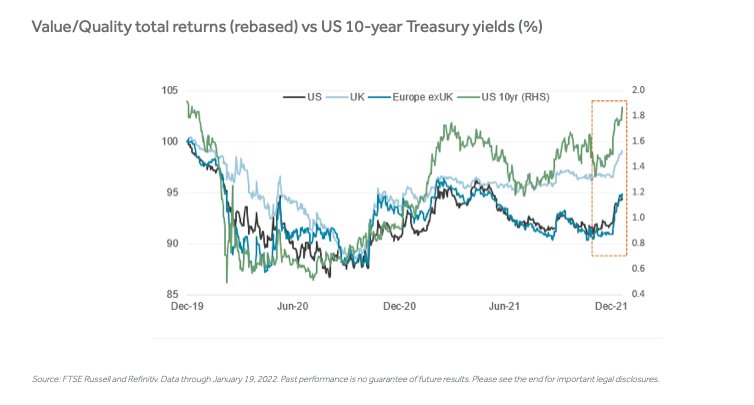
As the chart below illustrates, the battle for dominance between Value and Quality has been heavily influenced by the multiple shifts in bond-market signals since the onset of the pandemic.
Value trounced Quality amid the steep climb in the 10-year US Treasury yield in the final months of 2020 through March of 2021 – in reaction to the vaccine breakthroughs and brightening global economic outlook.
But Quality overtook Value through much of the summer and again in Q4 as new virus outbreaks, cooling economic indicators and hawkish central-bank pivots sent the US bond yield tumbling. Nervous investors sought refuge in steadier, higher-quality stocks better positioned to weather tougher economic conditions. Those included technology and other high-growth sectors that dominate Quality.
Risk Rotation
What the Q4 snapshot above masks is the dramatic spike in the US Treasury yield and Value outperformance across global equity markets since early December (the time series runs through January 19).
Both events coincided with the release of yet another unexpectedly hefty pickup in US inflation and the Fed’s early December meeting, where it outlined a much faster withdrawal of its easy-money policy support. Easing worries about the economic impact of Omicron have also played a role.
Tech stocks have taken the brunt of the early 2022 selloff, as rising yields diminish the attractiveness of their future cash flows. Reflation plays and beneficiaries of higher interest rates have outperformed in most markets, particularly financials, which dominate Value. Value is also significantly underweight technology.
P/E Gap
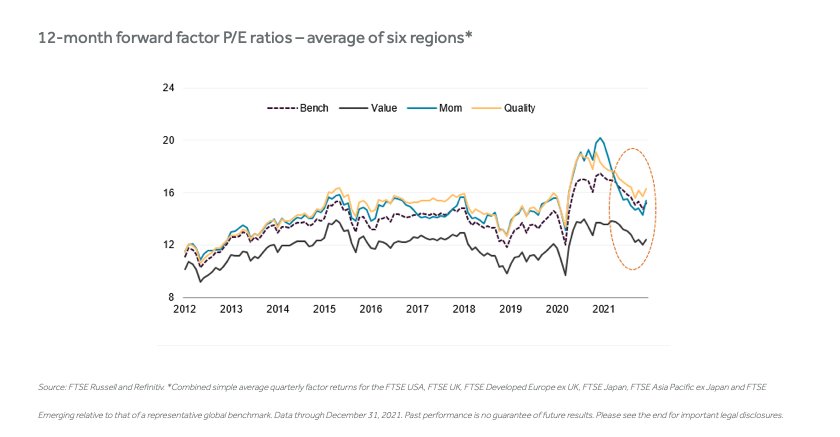
Despite its lengthy stretch of outperformance, Value continues to trade at a historically wide discount to Quality across markets based on 12-month forward EPS estimates, suggesting room for further expansion.
As the global recovery continues to unfold, the Value/Quality rivalry over the past year – and the key macro conditions underpinning it — hold important allocation implications for investors in the months ahead.
Source: FTSE Russell and Refinitiv. *Combined simple average quarterly factor returns for the FTSE USA, FTSE UK, FTSE Developed Europe ex UK, FTSE Japan, FTSE Asia Pacific ex Japan and FTSE Emerging relative to that of a representative global benchmark. Data through December 31, 2021.
This post first appeared on January 25 on the FTSE Russell blog.
Photo Credit: thenails via Flickr Creative Commons
DISCLOSURE
All information is provided for information purposes only. All information and data contained in this publication is obtained by the LSE Group, from sources believed by it to be accurate and reliable. Because of the possibility of human and mechanical error as well as other factors, however, such information and data is provided “as is” without warranty of any kind.
FTSE Russell is a subsidiary of London Stock Exchange Group that produces, maintains, licenses, and markets stock market indexes worldwide and in regional markets. The division is notable for FTSE 100 Index, Russell 2000 Index, among other indexes. Investors can’t invest directly in indexes.
Past performance is no guarantee of future results. Charts and graphs are provided for illustrative purposes only. Index returns shown may not represent the results of the actual trading of investable assets. Certain returns shown may reflect back-tested performance. All performance presented prior to the index inception date is back-tested performance. Back-tested performance is not actual performance, but is hypothetical. The back-test calculations are based on the same methodology that was in effect when the index was officially launched. However, back- tested data may reflect the application of the index methodology with the benefit of hindsight, and the historic calculations of an index may change from month to month based on revisions to the underlying economic data used in the calculation of the index.
This publication may contain forward-looking assessments. These are based upon a number of assumptions concerning future conditions that ultimately may prove to be inaccurate. Such forward-looking assessments are subject to risks and uncertainties and may be affected by various factors that may cause actual results to differ materially. No member of the LSE Group nor their licensors assume any duty to and do not undertake to update forward-looking assessments.


