By Steve Sosnick, Chief Strategist at Interactive Brokers
Two common market ideas are meeting in force this week. The first is “buy the dip,” a concept that many traders have become increasingly dependent upon.
The second is the idea that markets rally on the first trading day of a new month. Usually one of these factors is enough to boost markets.

Those of us who grew up reading The Traders’ Almanac are familiar with the first of the month idea. The rationale is based upon the idea that retirement accounts tend to receive money on the first of the month, more than on other days.
Over my career I’ve never been able to verify if that is indeed the case, but there is a potential logic to the assertion. But at this point, it doesn’t need to be true to be tradeable.
Self-Fulfilling Prophecy
If enough traders believe that buying stocks on the first day of the month is a winning strategy then it can become a self-fulfilling prophecy. And the results bear it out.
I did a quick calculation, and discovered the following: over the past 5 years, the average daily change in the S&P 500 Index was 0.067%, while the average daily change for the first trading day of the month was 0.228%. The strategy seems to make sense, at least superficially.
And while we’re on the topic of self-fulfilling strategies, buy-the-dip certainly deserves a mention. Over the years we’ve discussed this topic at length. During the course of the raging bull market of 2020-21, investors have been richly rewarded for buying stocks when they have fallen.
Quite frankly, with major indices and many popular stocks near all-time highs, it’s generally worked, at least for the most part.
Fiscal Fade
Even as the prospects for monetary and fiscal stimuli fade, there are sufficient available funds to allow stocks to rebound and a sufficient number of traders who are conditioned to consider every market decline to be a buying opportunity.
That said, buying the dip certainly does not work for all stocks at all times, as the following graph indicates. According to Bloomberg data, new lows on the NYSE have exceeded new highs by the widest margin in at least a year.
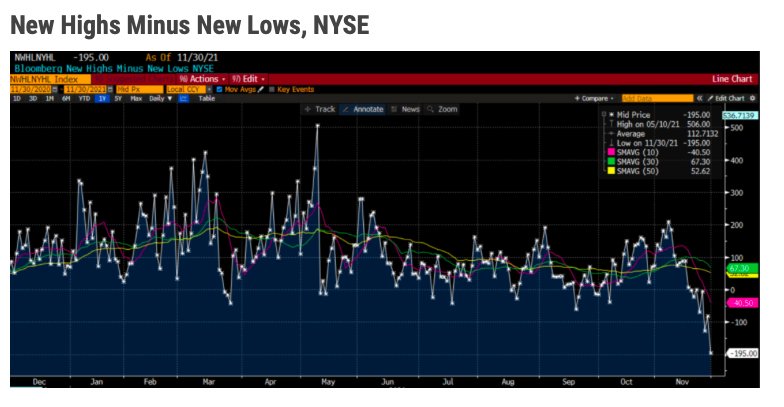
Source: Bloomberg
We can discuss the ramifications of new lows outpacing new highs even as SPX is just 1.2% below the all-time high set less than 2 weeks ago another time, but the point of the graph above is to show that not every dip in every stock is a buying opportunity.
Traders who bought losers on a dip last week still saw many of them lose even more over the ensuing days.
As I write this, equity markets are very much in a risk-on mode, while bonds are cooperating with slightly lower yields. With a 4-day pattern of down-up-down-up, all we can say right now is that we are in the midst of a bout of volatility.
Last week we wrote that “an unknown Covid strain would certainly be expected to add volatility to markets over the near term.” Throw in an unexpected change in language from the Fed Chair regarding inflation, and there is much to digest.
Volatility increases the number of opportunities available to traders, but those should be approached with a clear sense of risk and reward rather than reflexively.
This post first appeared on December 1 on the Traders’ Insight blog.
Photo Credit: thenails via Flickr Creative Commons
DISCLOSURE: INTERACTIVE BROKERS
The analysis in this material is provided for information only and is not and should not be construed as an offer to sell or the solicitation of an offer to buy any security. To the extent that this material discusses general market activity, industry or sector trends or other broad-based economic or political conditions, it should not be construed as research or investment advice. To the extent that it includes references to specific securities, commodities, currencies, or other instruments, those references do not constitute a recommendation by IBKR to buy, sell or hold such investments. This material does not and is not intended to take into account the particular financial conditions, investment objectives or requirements of individual customers. Before acting on this material, you should consider whether it is suitable for your particular circumstances and, as necessary, seek professional advice.
The views and opinions expressed herein are those of the author and do not necessarily reflect the views of Interactive Brokers LLC, its affiliates, or its employees. Any trading symbols displayed are for illustrative purposes only and are not intended to portray recommendations.
In accordance with EU regulation: The statements in this document shall not be considered as an objective or independent explanation of the matters. Please note that this document (a) has not been prepared in accordance with legal requirements designed to promote the independence of investment research, and (b) is not subject to any prohibition on dealing ahead of the dissemination or publication of investment research.