By Claire Hugo, Senior Analyst, SI Research
In the run-up to COP26, the UK has made it clear that negotiations will include finalizing the rules for implementing the Paris Agreement[1]. In particular, the creation of a voluntary and cooperative carbon market – which is addressed in Article 6 of the ‘Paris Rulebook’ – is expected to be the subject of much debate this year.
At present, with no consensus on a global carbon pricing yet reached among the Parties, 64 local initiatives have been established[2] and others are underway.
In particular, carbon border taxes are rapidly gaining ground to become a credible, even probable scenario, in the context of the significant increase in exports over the past decades.
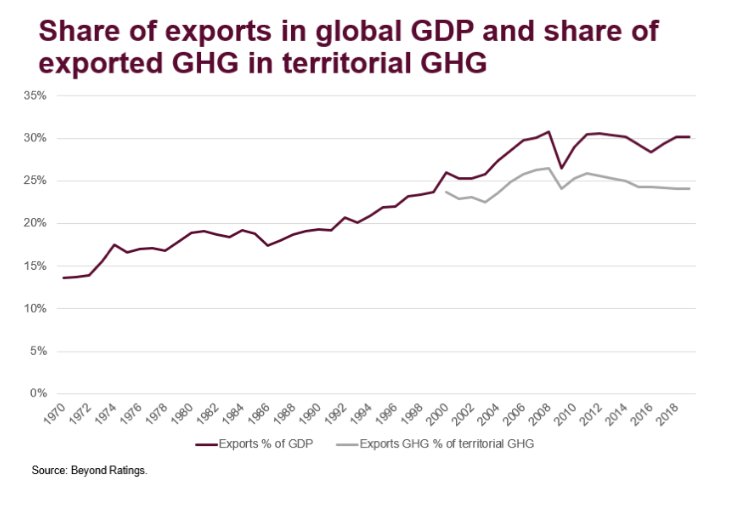
Figure 1 from our recent analysis shows that exports now account for 30% of global GDP, which represents around 25% of territorial GHG emissions.
Carbon Border Tax
If implemented, a carbon border tax could have significant consequences on the global markets and for investors. The version of such tax currently under the spotlight is the Carbon Border Adjustment Mechanism (CBAM) proposed in July 2021 by the European Commission[3].
It intends to make EU importers buy carbon certificates “corresponding to the carbon price that would have been paid, had the goods been produced under the EU’s carbon pricing rules”[4]. The CBAM’s purpose is to avoid “carbon leakage” by putting on an equal footing European countries subject to strict environmental standards, and exporting countries outside the EU less constrained by such regulations.
If approved, it could apply progressively from 2026 to the following sectors, chosen among the most emissive: electricity, iron and steel, cement, fertilisers, and aluminium.
GHG Imports
Ultimately, the European Commission is seeking to reduce imports whose production generates significant amounts of green-house gases (GHG) and therefore to promote less carbon-intensive processes.
The pricing and a better knowledge of carbon flows could help drive the reallocation of investments towards the energy transition and activities such as low-carbon energy production, energy renovation of buildings, public transport or energy efficiency of industries.
A carbon border tax could take a number of shapes and the CBAM’s proposal is only one of them. For instance, indirect emissions related to the use of electricity for manufacturing are not included in the European mechanism[5], and the carbon policies of exporting countries are not taken into account apart from the explicit price of carbon in the country of origin[6].
Regardless of its characteristics, the CBAM is certainly noteworthy because it signals a major change in approaches to carbon pricing. Our paper “Cross border carbon & potential carbon border taxes” explores this idea and looks at the principle of carbon border mechanisms and their potential macroeconomic and financial implications for investors.
Carbon Dynamics
A key aspect is the international impact of a border tax, which would affect not only the country or economic group that chooses to impose it but also its trade partners, and could eventually lead other regions to considering similar schemes.
By correcting the problems of carbon price differentiation between countries, it is likely to alter the competitiveness of countries’ exports. This could be the case, for example, for countries with more carbon-intensive energy systems or greater dependency on exports from high-emitting economic sectors. In the long term, a change in market trades based on the carbon efficiency of countries could be envisioned.
Some countries are more at risk from such developments, notably emerging markets whose exports are often more carbon intensive. This is illustrated in Figure 2 that presents the GHG content of exports (by unit of exports value) and the size of exports in the economy (in % of GDP) for 50 focus countries[7].
All countries within the scope have a share of exports larger than 10% of GDP, which is already a significant exposure. However, almost all countries with high carbon intensity of exports – beyond a threshold of 400 tCO2e / USD millions of exports – are emerging markets. Using the CBAM example, the additional cost for developing countries’ exports to the EU could reach $16 billion, which could have the effect of reducing development-led opportunities for these countries[8].
On the other end of the spectrum, the most export-exposed countries –above 60% of GDP– have relatively moderate levels of carbon intensity of exports, which could help mitigate their risks.
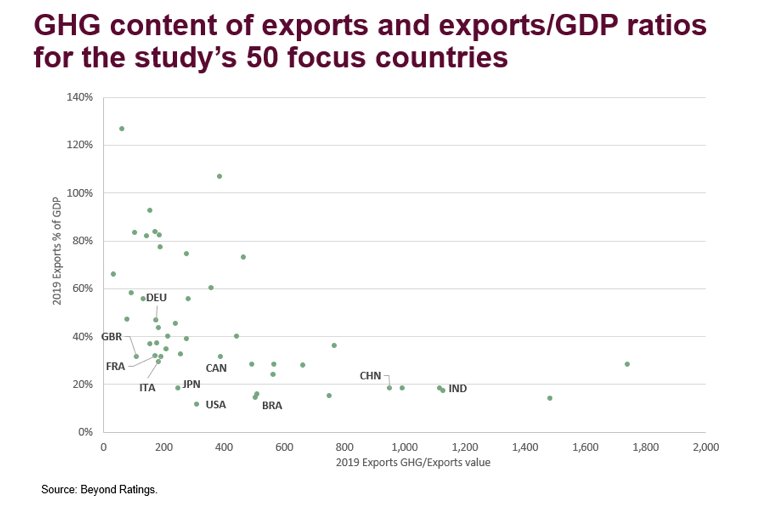
Note: three countries are not shown due to high values, i.e. Pakistan (3,530 tCO2e / USD million and 10% values), Ethiopia (15,429 tCO2e / USD million and 8%) and Luxembourg (36 tCO2e / USD million and 209%).
Uncertainties Ahead
The path to carbon border pricing policies is still paved with uncertainties and associated debates. As impacts are expected on trade flows, there will be losers and winners from such policies, with country and sector implications as well as material capital reallocations. However, it is already possible to anticipate some of the upcoming risks and opportunities.
From a practical perspective, studying carbon tariffs at the border would also add a dimension to stress tests as a factor that could drive future developments. This could help strengthen investors’ long-term approaches to risk management, by providing additional insight into the complexity of possible climate pathways or political choices.
This post first appeared on October 21 on the FTSE-Russell blog.
Photo Credit: Kevin Gill via Flickr Creative Commons
FOOTNOTES
[1]UN Climate Change Conference 2021. (2021). COP26 Explained
[2]As of October 2021. See: World Bank. (2021, 12 October). Carbon Pricing Dashboard.
[3]The CBAM is one of the legislative proposals included in the ‘Fit for 55’ package presented by the European Commission on July 14, 2021, which aims to put the European Union on a path to reduce its greenhouse gas emissions by at least 55% by 2030. These proposals must now be examined separately by the Council and the European Parliament, and then negotiated by the two co-legislators during a trialogue phase.
[4]European Commission. (2021, 14 July). Proposal for a Regulation of the European Parliament and of the Council establishing a carbon border adjustment mechanism. Brussels.
[5]Although this could be reconsidered in 2026. See: Marcu, A., Maratou, A. Mehling M., Cosbey, A. (2021). The EU Carbon Border Adjustment Mechanism (CBAM), Preliminary analysis of the European Commission proposal for a regulation establishing a Carbon Border Adjustment Mechanism, 14 July 2021 (COM(2021) 564 FINAL).European Roundtable on Climate Change and Sustainable Transition (ERCST).
[6]The OECD is calling for the EU approach to also include implicit carbon taxes to match other carbon-reducing measures such as banning coal-fired power plants. See: Fleming, S., Giles, C. (2021, 13 September). OECD seeks global plan for carbon prices to avoid trade wars, Financial Times
[7]The study focuses on 50 large economies that cover about 90% of global GDP, 95% of government debt, and 75% of population based on 2019 data, as well as about 80% of territorial greenhouse gas (GHG) emissions.
[8] Lowe S. (2021). The EU’s carbon border adjustment mechanism: How to make it work for developing countries. Centre for European Reform. In: United Nations Conference on Trade and Development (UNCTAD). (2021). A European Carbon Border Adjustment Mechanism: Implications for developing countries. Geneva.
DISCLOSURE
All information is provided for information purposes only. All information and data contained in this publication is obtained by the LSE Group, from sources believed by it to be accurate and reliable. Because of the possibility of human and mechanical error as well as other factors, however, such information and data is provided “as is” without warranty of any kind. No member of the LSE Group nor their respective directors, officers, employees, partners or licensors make any claim, prediction, warranty or representation whatsoever, expressly or impliedly, either as to the accuracy, timeliness, completeness, merchantability of any information or of results to be obtained from the use of FTSE Russell products, including but not limited to indexes, data and analytics, or the fitness or suitability of the FTSE Russell products for any particular purpose to which they might be put.
Any representation of historical data accessible through FTSE Russell products is provided for information purposes only and is not a reliable indicator of future performance. No responsibility or liability can be accepted by any member of the LSE Group nor their respective directors, officers, employees, partners or licensors for (a) any loss or damage in whole or in part caused by, resulting from, or relating to any error (negligent or otherwise) or other circumstance involved in procuring, collecting, compiling, interpreting, analysing, editing, transcribing, transmitting, communicating or delivering any such information or data or from use of this document or links to this document or (b) any direct, indirect, special, consequential or incidental damages whatsoever, even if any member of the LSE Group is advised in advance of the possibility of such damages, resulting from the use of, or inability to use, such information.
Past performance is no guarantee of future results. Charts and graphs are provided for illustrative purposes only. Index returns shown may not represent the results of the actual trading of investable assets. Certain returns shown may reflect back-tested performance. All performance presented prior to the index inception date is back-tested performance. Back-tested performance is not actual performance, but is hypothetical. The back-test calculations are based on the same methodology that was in effect when the index was officially launched. However, back- tested data may reflect the application of the index methodology with the benefit of hindsight, and the historic calculations of an index may change from month to month based on revisions to the underlying economic data used in the calculation of the index.
This publication may contain forward-looking assessments. These are based upon a number of assumptions concerning future conditions that ultimately may prove to be inaccurate. Such forward-looking assessments are subject to risks and uncertainties and may be affected by various factors that may cause actual results to differ materially.