Real Estate is hot. This summer, home prices rose 18.6% in the year ended in June. As the Wall Street Journal tells us, June marked the highest annual rate of price growth since the index began in 1987.
Let that sink in a moment. This new record high in the rate of price growth means we have just surpassed the highs of the housing bubble of the mid 2000s.
It’s a Seller’s Market
Home prices have skyrocketed in the past year due to a combination of events. The inventory of homes for sale remains well below typical levels as a result of the pandemic. And the all-time low interest rates have spurred demand.
When interest rates are low consumers perceive that they can afford to pay more for a home. As a result, homes listed for sale this past spring and summer received multiple offers and sold above the asking price.
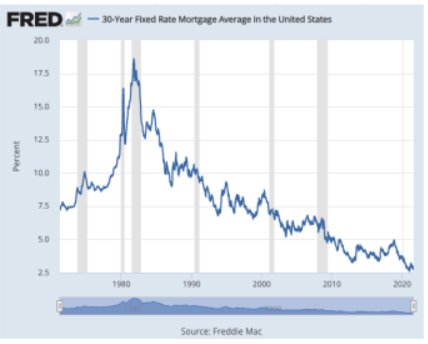
Since interest rates peaked during the height of inflation in the early 1980s, mortgage rates have been coming down. This has generally been a tailwind for home buyers as mortgages are easier to pay off with lower interest rates.
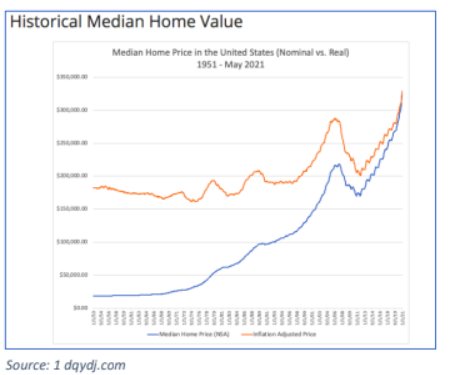
However, lower interest rates leads to higher prices as buyers can afford “more house” for their monthly payment. We can see this clearly in the graph of median home values.
Bubbly Market
In the past 10 years mortgage rates have hovered at record low levels. At the same time, home prices have surpassed prices during the housing bubble of the mid- 2000s on an inflation adjusted basis.
Recently, headlines have been announcing the return of inflation. A return of inflation in this context would cause interest rates to rise and home prices to fall.
Is it too late to make an investment? To answer that question we’ll take a look at some historical data to get a sense of how today’s prices compare to long run averages.
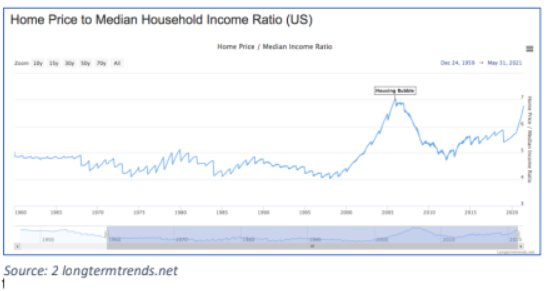
From 1960 until the early 2000s the price of the median home fluctuated between 4 and 5 times the median household income. At the top of the housing bubble this multiple had increased 75% from its lows to 7 times the median income, according to my analysis..
Cap Rate
When the bubble finally burst, however, the multiple only returned to its previous high of 5 times the median income.
Today we are once again approaching the highs of the bubble peak with home prices at 6.79 times the median income as of May 2021. Another way to measure whether a real estate investment is a bargain is by looking at the cap rate that can be earned on a property.
The cap rate is the revenues earned on a property less all operating expenses divided by the value of the property. Financing costs are not included in this calculation. So, a mortgage would not be figured into the calculation.
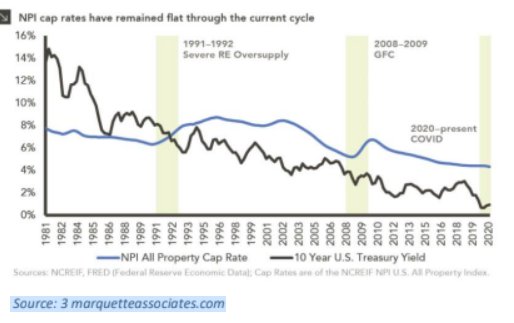
Historically, a cap rate of 7.5% was approximately the average rate from 1981 until the housing bubble in the mid-2000s. That meant that you as a landlord could expect to get a 7.5% return on the value of your property per year. When the cap rate rose much above 7.5% it usually meant that property prices were cheap. Conversely, when prices dipped much below that level it meant that properties were richly valued.
Today the cap rate is at historic lows, implying that property prices are elevated. Part of this fall in cap rates is due to the historically low interest rate environment.
However, a large role is being played by the fall in office and retail property prices. In contrast, residential housing and industrial properties have benefited in price appreciation.
Sales Starting to Slow
We can get a sense of how long this hot real estate market may last by looking at data that reflects home buying and data that tells us about consumer sentiment.
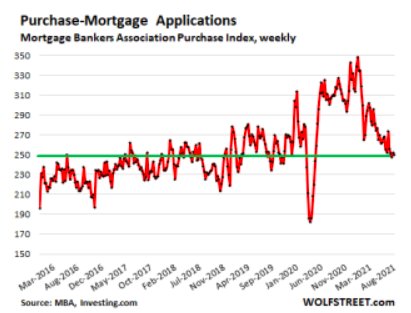
Two pieces of data recently released show that the rate of home-buying may be slowing. The chart at left shows that applications for new mortgages have dropped 19% in mid-August on a year over year basis. Pending home sales registered a drop of 1.8% in July from June.
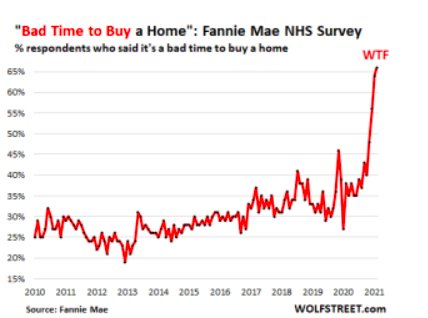
Consumer sentiment is a good indicator of future buying behavior. In a recent National Housing Survey by Fannie Mae, Americans are saying it’s a terrible time to buy a home. Since the survey began in 2010, the latest reading of 66% is a new record of the percentage of respondents saying that “It’s a bad time to buy a home.”
Takeaway
All this adds up to some things that you might want to consider as we move into the fall. Historically high prices and low interest rates offer a great environment for folks with real estate to sell.
It’s a seller’s market. If you are thinking of downsizing or have investment property this might be a good time to sell. We are now in a seller’s market but that may soon start to change if either interest rates go up or the economy turns down.
The real estate market does not normally move as fast as the stock market. In the housing bubble of the mid 2000s, it took about 6 years for prices to hit bottom. During that time, it was a buyer’s market and sales were difficult and usually at below the asking price. In my opinion, that’s exactly the opposite of the selling environment today.
Photo Credit: Andreas Riemenschneider via Flickr Creative Commons
Disclosure
This publication may contain forward-looking assessments, which are based upon a number of assumptions concerning future conditions that ultimatelymay prove to be inaccurate. Such forward-looking assessments are subject to risks and uncertainties and may be affected by various factors that may cause actualresults to differ materially. This letter is provided as educational information only and is not intended to provide investment or other advice. This material is not tobe construed as a recommendation or solicitation to buy or sell any security, financial product, instrument, or to participate in any particular trading strategy.