

By Philip Lawlor, head of Global Investment Research
Global equity markets rode the COVID-19 shockwaves from panic to a record-breaking finale in 2020, capping a year of economic trauma and dramatic reversals in risk sentiment and market leadership.
With many markets hitting new or multi-year highs, the FTSE All-World Index ended 2020 up 14.4%. But this achievement belies the massive gyrations that world markets endured over the course of the year, powered by huge swings between risk-on and risk-off forces.
Here we highlight four notable features of equity market behavior in 2020.
#1 – Five distinct phases
Source: FTSE Russell. Data as of December 31, 2020. Past performance is no guarantee of future results. Please see the end for important legal disclosures.
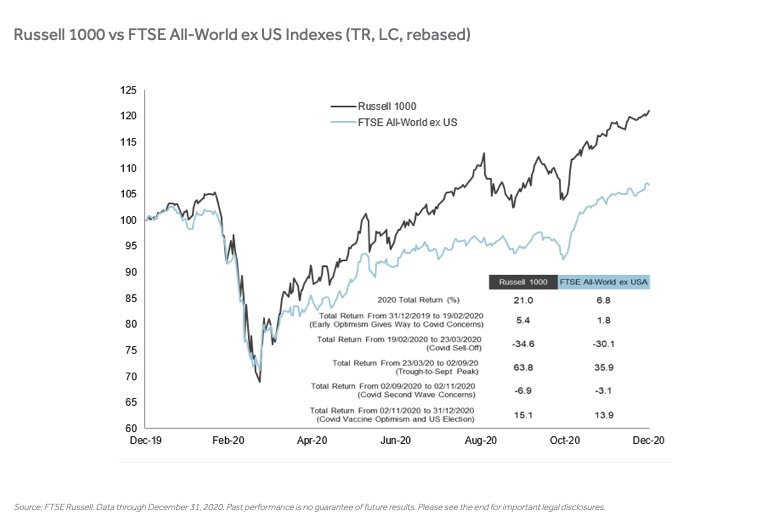
As depicted above, 2020 equity performance can be divided into five distinct phases:
- Early optimism (Jan–Feb 19) Global equities rise 3.8% in early 2020, despite a virus outbreak in China and other parts of Asia.
- Covid-19 sell-off (Feb 19‒Mar 23) The trigger: surging COVID-19 cases in Italy. Virus spreads rapidly; lockdowns bring world economy to a standstill; stocks in freefall; 10yr US and UK bond yields fall below 1% for first time ever.
- Policy-fueled recovery (Mar 23–Sep 2) Central banks launch aggressive monetary intervention, while governments pass massive fiscal rescue packages.
- Second-wave fears (Sep 2–Nov 11) The resurgence in new COVID-19 cases raises doubts about the economic recovery and stirs market volatility.
- Vaccine hopes & more policy support (Nov 11–present) Risk rally accelerates, spurred by new rounds of monetary and fiscal stimulus, US election results and positive vaccine news flow.
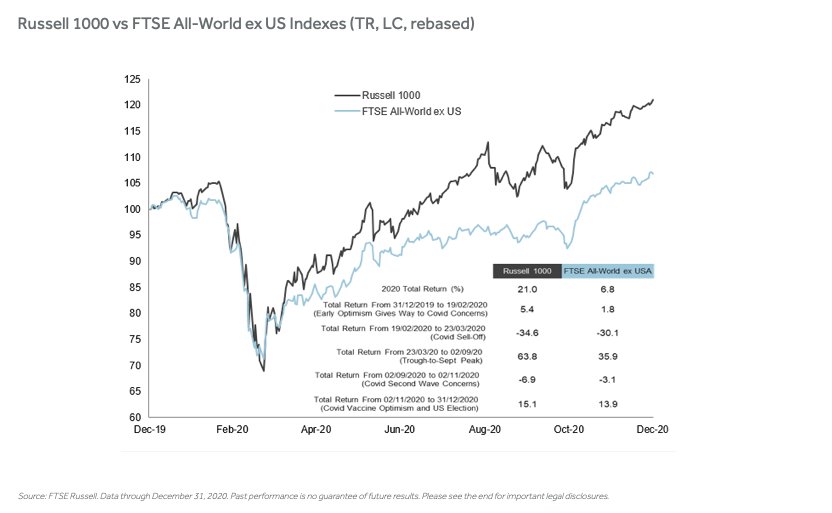
#2 – US stocks lead the global pack
Despite suffering steeper losses in the March panic and again in the September/October correction, the Russell 1000 finished 2020 with a threefold lead over its global peers (up 21% versus 6.8%, respectively). Much of this full-year outperformance occurred in early stages of the post-lockdown relief rally, when the US large-cap index rallied at twice the pace of the rest of the world, reflecting the haven status and perceptions of its relatively stronger recovery prospects of the US economy, as well as its heavier weightings in technology and other COVID-lockdown outperformers.
Source: FTSE Russell. Data through December 31, 2020. Past performance is no guarantee of future results. Please see the end for important legal disclosures.
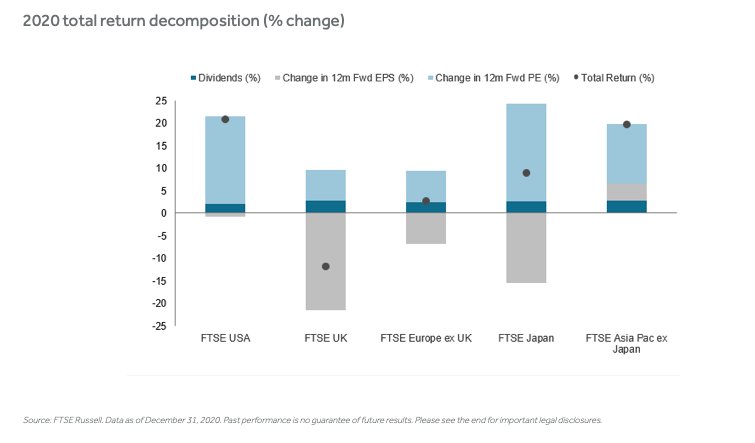
#3 – Valuation expansion a key driver
As was the case globally, P/E multiple expansion, rather than dividend or forecast EPS growth, dominated US total returns in 2020, as the decomposition below illustrates.
Source: FTSE Russell. Data as of December 31, 2020. Past performance is no guarantee of future results. Please see the end for important legal disclosures.
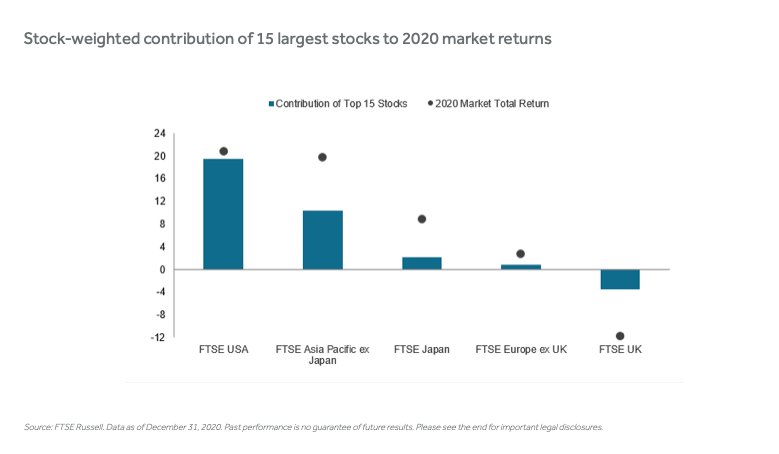
#4 – US tallies the most concentrated return contributions
US outperformance also benefited from a much higher concentration of gains among its largest stocks by market capitalization. As the chart below shows, the contributions of the largest 15 US stocks accounted for nearly all of US returns, twice the share of the market with the next best record, in the FTSE Asia Pacific ex Japan. Return contributions of the largest stocks were the weakest in Europe ex UK and negative in the UK.
Source: FTSE Russell. Data as of December 31, 2020. Past performance is no guarantee of future results. Please see the end for important legal disclosures.
This article first appeared on Jan. 5 on the FTSE Russell blog.
Photo Credit: Pictures of Money via Flickr Creative Commons
© 2021 London Stock Exchange Group plc and its applicable group undertakings (the “LSE Group”). The LSE Group includes (1) FTSE International Limited (“FTSE”), (2) Frank Russell Company (“Russell”), (3) FTSE Global Debt Capital Markets Inc. and FTSE Global Debt Capital Markets Limited (together, “FTSE Canada”), (4) MTSNext Limited (“MTSNext”), (5) Mergent, Inc. (“Mergent”), (6) FTSE Fixed Income LLC (“FTSE FI”), (7) The Yield Book Inc (“YB”) and (8) Beyond Ratings S.A.S. (“BR”). All rights reserved.
FTSE Russell® is a trading name of FTSE, Russell, FTSE Canada, MTSNext, Mergent, FTSE FI, YB and BR. “FTSE®”, “Russell®”, “FTSE Russell®”, “MTS®”, “FTSE4Good®”, “ICB®”, “Mergent®”, “The Yield Book®”, “Beyond Ratings®” and all other trademarks and service marks used herein (whether registered or unregistered) are trademarks and/or service marks owned or licensed by the applicable member of the LSE Group or their respective licensors and are owned, or used under licence, by FTSE, Russell, MTSNext, FTSE Canada, Mergent, FTSE FI, YB or BR. FTSE International Limited is authorised and regulated by the Financial Conduct Authority as a benchmark administrator.
FTSE All-World index series is a stock market index that covers over 3,100 companies in 47 countries starting in 1986. It is calculated and published by the FTSE Group, a wholly owned subsidiary of the London Stock Exchange which originated as a joint venture between the Financial Times and the London Stock Exchange. One cannot invest directly in an index.
All information is provided for information purposes only. All information and data contained in this publication is obtained by the LSE Group, from sources believed by it to be accurate and reliable. Because of the possibility of human and mechanical error as well as other factors, however, such information and data is provided “as is” without warranty of any kind. No member of the LSE Group nor their respective directors, officers, employees, partners or licensors make any claim, prediction, warranty or representation whatsoever, expressly or impliedly, either as to the accuracy, timeliness, completeness, merchantability of any information or of results to be obtained from the use of FTSE Russell products, including but not limited to indexes, data and analytics, or the fitness or suitability of the FTSE Russell products for any particular purpose to which they might be put. Any representation of historical data accessible through FTSE Russell products is provided for information purposes only and is not a reliable indicator of future performance.
No responsibility or liability can be accepted by any member of the LSE Group nor their respective directors, officers, employees, partners or licensors for (a) any loss or damage in whole or in part caused by, resulting from, or relating to any error (negligent or otherwise) or other circumstance involved in procuring, collecting, compiling, interpreting, analysing, editing, transcribing, transmitting, communicating or delivering any such information or data or from use of this document or links to this document or (b) any direct, indirect, special, consequential or incidental damages whatsoever, even if any member of the LSE Group is advised in advance of the possibility of such damages, resulting from the use of, or inability to use, such information.
No member of the LSE Group nor their respective directors, officers, employees, partners or licensors provide investment advice and nothing contained in this document or accessible through FTSE Russell Indexes, including statistical data and industry reports, should be taken as constituting financial or investment advice or a financial promotion.
Past performance is no guarantee of future results. Charts and graphs are provided for illustrative purposes only. Index returns shown may not represent the results of the actual trading of investable assets. Certain returns shown may reflect back-tested performance. All performance presented prior to the index inception date is back-tested performance. Back-tested performance is not actual performance, but is hypothetical. The back-test calculations are based on the same methodology that was in effect when the index was officially launched. However, back- tested data may reflect the application of the index methodology with the benefit of hindsight, and the historic calculations of an index may change from month to month based on revisions to the underlying economic data used in the calculation of the index.
This publication may contain forward-looking assessments. These are based upon a number of assumptions concerning future conditions that ultimately may prove to be inaccurate. Such forward-looking assessments are subject to risks and uncertainties and may be affected by various factors that may cause actual results to differ materially. No member of the LSE Group nor their licensors assume any duty to and do not undertake to update forward-looking assessments.
No part of this information may be reproduced, stored in a retrieval system or transmitted in any form or by any means, electronic, mechanical, photocopying, recording or otherwise, without prior written permission of the applicable member of the LSE Group. Use and distribution of the LSE Group data requires a licence from FTSE, Russell, FTSE Canada, MTSNext, Mergent, FTSE FI, YB and/or their respective licensors.


