

As the year draws to a close, I want to focus your attention on the tremendous opportunities that lie ahead in 2021. In the last few months, we discussed the enormous dislocations in the economy.
Historically, investments tend to move in large cycles in my opinion. For the past 12 years or so we have seen an outperformance by the US stock markets. And within the US markets, growth stocks such as those found in the technology sector have outperformed most investments.
In investing, we use the analogy of a rubber band being stretched when values are at extremes.
Value Stocks
This analogy applies when stock market prices are either severely over-priced or severely underpriced. For as much as growth and tech stocks are now over-priced, value stocks are now severely underpriced. And, as in the rubber band analogy, when prices are stretched to extremes they tend to snap back quickly.
For the past decade or so, value stocks have been underperforming growth stocks. By value stocks I refer to the stocks of companies that trade cheaply in comparison to their traditional earnings or other measure of valuation.
During the popping of the Internet Bubble, the famous value fund manager GMO was able to earn 80% by selling short over-valued tech shares and buying value stocks, according to my research. Amazingly, the S&P 500 dropped about 36% during this same time period.
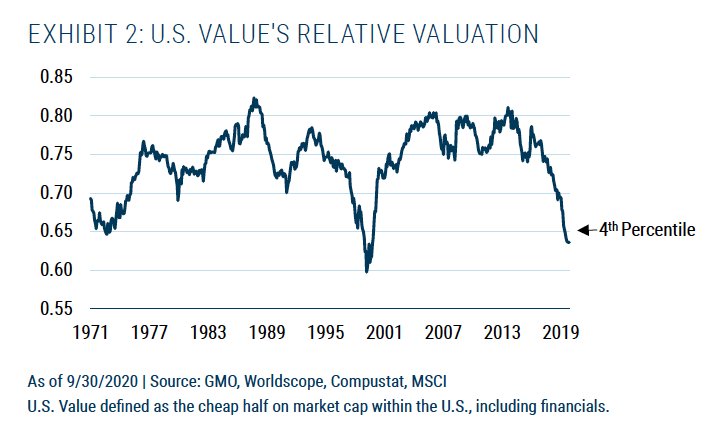
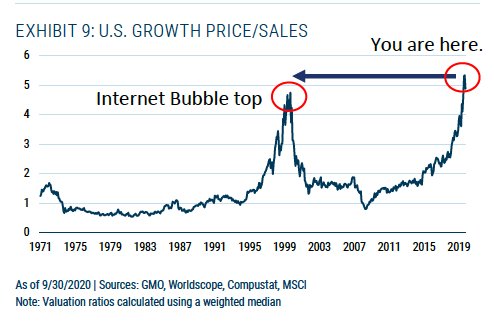
Currently, as can be seen in the graph, value stocks are in the 4th percentile of historical value. In my view, that means that they have rarely been as cheap to buy as they are at today’s prices. That’s roughly in line with the prices of the early 1970’s and a little more expensive than during the Internet Bubble era.
Tech Sector
After each one of these previous episodes, value stocks strongly outperformed the rest of the stock market. Today, value stocks can be found in all the areas left behind by the current bull market in growth and technology shares. These areas include small cap stocks across the developed world, emerging markets, and commodities and their producers.
Rubber band of prices snaps back, we call it a reversion to the mean. It is this reversion to fair value that constitutes the basis for value investing.
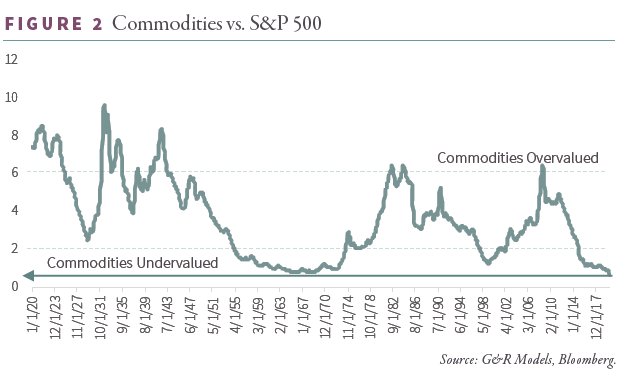
Turning our attention to commodities such as oil, copper, and corn we see an even more extreme situation. The below chart compares an index of commodities relative to the S&P 500. As you can see, commodities are the cheapest they have been in the past 100 years.
.
Going back 100 years, each time commodities were deeply undervalued relative to the broad stock market they staged enormous rallies.
As the chart above shows, these rallies led to a tripling or more of commodity prices. In my view, sectors as varied as agriculture, base metals, gold and oil are at severely depressed prices relative to the S&P 500. At these prices little investment has been made in finding new sources of these commodities. Yet, as more and more countries around the world advance into the modern age, the demand for basic materials has been increasing.
As the saying goes, in order to buy low and sell high, you first have to buy low.
Energy Sector
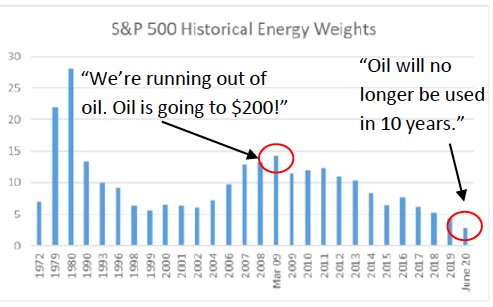
The energy sector shows a similar picture to that for commodities. Here we are looking at 50-year extremes in prices of companies in the energy sector. At 2% of the S&P 500, the energy sector is at the lowest level in at least 50 years.
Historically, the energy sector has averaged about 9% of the S&P 500 going back to 1990. The energy sector would need to more than quadruple as a percent of the S&P 500 just to return to its historic average of the past 30 years.
As investments, companies that produce commodities such as energy have operational leverage to the price of a commodity. This operational leverage means that as the price of a commodity goes up the company’s earnings multiply.
In the past few years, concerns over global warming have served to drive investment away from oil and gas. Energy companies are being priced as if they will be out of business within ten years. However, the reality remains that the emerging world is increasing their use of oil and gas on an annual basis.
Possible Rebound
The lack of investment in the sector will create shortages as economies open back up after the Covid virus. These shortages will in turn provide higher prices and therefore strong profits for the energy sector. As investors realize that this is the case, the stocks of the companies in the energy sector will reprice higher.
If there is one thing I would like you all to come away with today, it is that natural resources move in long cycles from radical undervaluation to radical overvaluation. It is a cycle that has repeated itself 3 times over the last 100 years, and our research tells us that a fourth cycle has now started.
We are presently in a period of extremely low commodity prices (except for gold which we will discuss) but this is about to reverse itself. No one has any exposure to this sector today and if we are right, rethinking your views on real assets and commodities will be critical to you and your clients’ portfolios going forward.
Bull Market Cycle
We are on the verge of a new, huge bull market cycle in natural resources investments and this shift will likely be the most important investment theme of the coming decade.
Let me show you why. Today’s presentation is as much about financial history as it is about supply and demand. Even though the three cycles I will discuss today, occurred in three completely different economic eras, the same underlying forces that pushed both commodities prices and the prices of financial assets in different directions were all strongly present in each.
All these conditions are strongly in evidence right now as I speak. What follows is an investment saga that goes back over 100 years and demonstrates a regular pattern of boom and bust, and the emergence of recognizable forces that have repeated themselves over and over again.
Our study started with a fairly simple idea. Given that commodities are one of the major inputs in an economy, and the stock market is a proxy for the value of the economy, there should be some relationship between commodity prices and stock prices over time.
You may have seen this chart in the past. It tracks the price of commodities divided by the S&P 500 since 1920. A more common version of this chart starts in 1980 because that was the starting point of the most used commodity price index: the Goldman Sachs Commodity Index or GSCI.
Unfortunately, commodity cycles can last up to two or three decades and so a chart that begins in 1980 is not very helpful. Instead, we created our own commodity price index that closely follows the GSCI methodology and extended it back to 1920.
Political Risks
There’s just one obstacle to buying all these opportunities today, that is the record extremes we are seeing in the stock market. It may be that Congress passes enough stimulus to paper over valuations. More likely, we will soon see a return toward historical values.
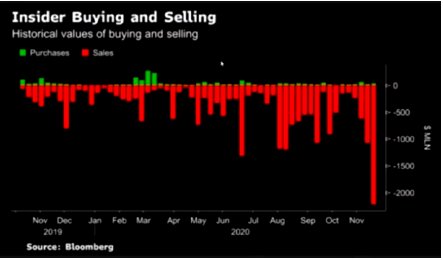
In November and the first part of December investors flooded into the stock market expecting riches into the foreseeable future. At the same time, insiders—those with management responsibility at public companies—were selling at the fastest pace in years.
For insight into why insiders may be selling at a record pace we need only look at a chart of price to sales for growth stocks. US large cap growth stocks have led the bull market over the past decade. These are the largest, most well-known companies in the world. The 5 largest of these–Apple, Amazon, Google, Facebook, and Microsoft—account for much of the growth of the S&P 500 in recent years.
The chart at left shows that the median large cap growth company now sells at a price to sales ratio that is even higher than during the Internet bubble.
When the Internet bubble popped in March of 2000, the Nasdaq went on to lose 84% of its value over the following 2 1⁄2 years. There is no guarantee that we see the same thing happens this time. However, historically, parabolic rises lead to parabolic declines.
Takeaway
With patience an investor can make great use of cash on the sidelines. This is exactly what Warren Buffett has done over his career. In fact, at the beginning of the 4th quarter Berkshire Hathaway had on hand $145.72 billion. That’s the most cash Mr. Buffett has had on hand since at least 2008.
Like Mr. Buffett, our portfolios are sitting on a large amount of cash waiting for prime opportunities to present themselves. Likewise, we hold a significant amount of US treasury bonds that will act as a safe haven in the case of any market disruption.
Having the ability to make purchases when others are selling into fear is a huge advantage. With cash and treasury bonds we are maximizing our ability to take advantage of bargains when they become available.
In addition, we will have the mental and psychological flexibility that comes from sidestepping a precipitous drop in the stock market. For now, our job is to wait patiently for those bargains to appear.
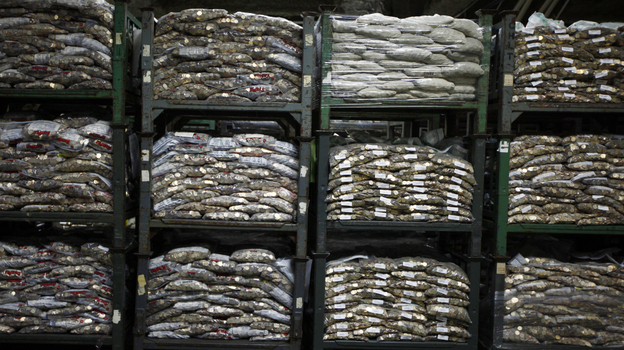
Photo Credit: 沙子 via Flickr Creative Common
DISCLOSURE
This publication may contain forward-looking assessments, which are based upon a number of assumptions concerning future conditions that ultimately may prove to be inaccurate. Such forward-looking assessments are subject to risks and uncertainties and may be affected by various factors that may cause actual results to differ materially.
This letter is provided as educational information only and is not intended to provide investment or other advice. This material is not to be construed as a recommendation or solicitation to buy or sell any security, financial product, instrument, or to participate in any particular trading strategy.
The S&P GSCI® is a composite index of commodity sector returns representing an unleveraged, long-only investment in commodity futures that is broadly diversified across the spectrum of commodities. The returns are calculated on a fully collateralized basis with full reinvestment. The combination of these attributes provides investors with a representative and realistic picture of realizable returns attainable in the commodities markets. Investors can’t invest directly in an index.


