

Last week, I noted the enthusiasm that options traders showed for Tesla (TSLA) ahead of its earnings release after the close on Wednesday, October 21st. Traders were willing to pay higher implied volatilities for upside calls than they were for downside puts.
I attributed this to the cult-like enthusiasm that TSLA enjoys among its investor base. Upon further analysis, that may be an incomplete assertion. It turns out that Netflix (NFLX) options show similar enthusiasm ahead of that company’s release after the close on Tuesday, October 20th.
Options traders pay close attention to company earnings releases. They fall into the category of “known unknowns.” While most traders have no particular insight into the likelihood that a given company will exceed or miss the consensus estimate, the timing of the event is typically disclosed in advance and they know that earnings releases are often followed by extra volatility. In short, they know that something is likely to bring volatility around earnings day, even though they don’t know the direction or the magnitude of the ensuing move.
Earnings Outlook
Although traders have no way of knowing what may occur after a company releases earnings, they have history to guide them. According to Bloomberg data, over the past 8 quarters, NFLX has beaten its consensus estimate 7 times, with an average surprise of 23%. After those 8 releases the stock fell 6 times, with a 2.59% average decline.
The biggest gain was 5.28% in October 2018; the biggest decline was 10.27% in July 2019. Experienced traders are familiar with the market phenomenon that tends to punish companies that fail to meet expectations more heavily than they reward those who beat them. It would appear that caution would be warranted for NFLX traders ahead of earnings.
Yet options prices for NFLX display enthusiasm, not caution. Consider the following graph:
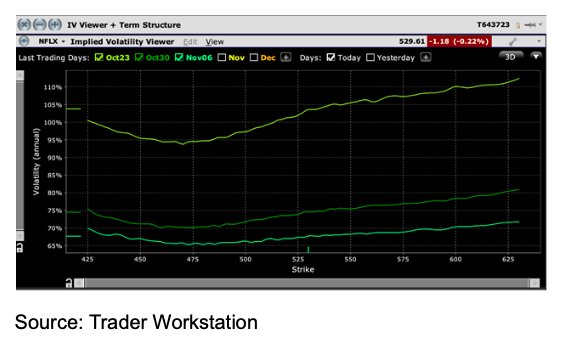
Source: Trader Workstation
Volatility
This graph displays the implied volatilities of NFLX options over a range of strike prices for selected expirations. I used my TWS to generate the graph, using the IV Viewer feature. I constrained the X-axis to +/- 20% and displayed the next 3 weekly expirations. The line at the top shows the October 23rd weekly expiration.
It is no surprise that the market anticipates the highest volatility for expiration week. It is quite surprising, however, to see traders willing to pay higher prices for options that anticipate a price rise after earnings when recent history demonstrates otherwise.
Perhaps those traders have long memories. Double digit percentage changes after earnings – up and down – were common for NFLX during the 2015-2017 period. But bear in mind that NFLX was a much smaller company then – about ¼ of its current size. A 10% move in NFLX would now imply about a $23bn change in market capitalization, which is a staggering number.
Cult Following
Taken in light of NFLX, the pricing for TSLA can’t be viewed strictly as cultish. Rather, it appears to be part of a broader enthusiasm for the mega-capitalized tech stocks that have led markets higher throughout the past year.
Note the similarity:
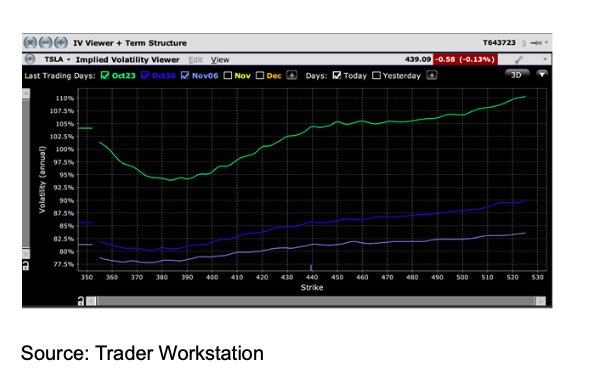
Source: Trader Workstation
TSLA has bounced after 3 of its last earnings releases, with those moves ranging from 9.14% to 17.67%. The downside moves have been more muted, though the largest was a substantial -13.61% drop. Bear in mind that TSLA has roughly tripled over the past few months on the back of a stock split and hopes of it joining the S&P 500 Index (SPX).
The stock has held its gains despite the facts that a stock split has no bearing on company fundamentals, of course, and the SPX Index committee has shown no inclination to add TSLA to the index. Will investors be as enthusiastic if earnings meet consensus this quarter, let alone if they miss?
For comparison, we should take a look at the earnings-related skew for a similarly sized company reporting earnings this week. Verizon (VZ) is scheduled to report before the market opens on Wednesday, October 21st. The difference in its implied volatility should be immediately evident in the graph below:
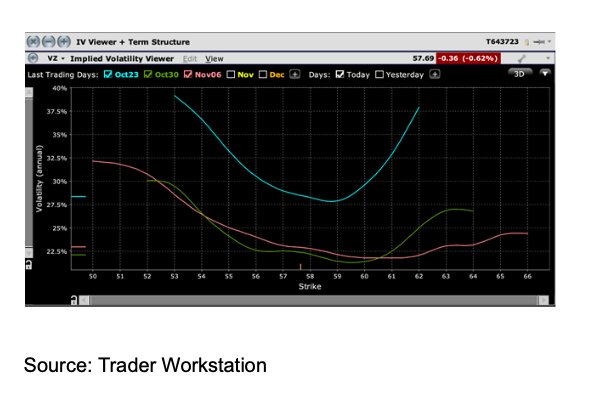
Source: Trader Workstation
This would be considered a much more typical pattern ahead of earnings. The earnings week shows the highest volatility overall, but the skew is steeper to the downside than the upside. This reflects the general tendency for markets to penalize underperformance asymmetrically.
Takeaway
That said, even the VZ skew shows some enthusiasm for an upside surprise.
Perhaps this is the lesson that traders should take into this earnings season. Traders seem willing to buy options that benefit from an upside surprise, though that trend is much more pronounced in some of the market’s true tech darlings.
We will know soon enough if this enthusiasm was warranted. In the meantime, investors who hold positions in stocks that report earnings in the coming weeks should do their best to determine whether market expectations are indeed appropriate.
Photo Credit: Pictures of Money via Flickr Creative Commons
DISCLOSURE: INTERACTIVE BROKERS
The analysis in this material is provided for information only and is not and should not be construed as an offer to sell or the solicitation of an offer to buy any security. To the extent that this material discusses general market activity, industry or sector trends or other broad-based economic or political conditions, it should not be construed as research or investment advice. To the extent that it includes references to specific securities, commodities, currencies, or other instruments, those references do not constitute a recommendation by IBKR to buy, sell or hold such investments. This material does not and is not intended to take into account the particular financial conditions, investment objectives or requirements of individual customers. Before acting on this material, you should consider whether it is suitable for your particular circumstances and, as necessary, seek professional advice.


