

Matthew J. Bartolini, CFA, Head of SPDR Americas Research, State Street Global Advisors
With the S&P 500® up 21% off its March 24 lows and just 13% below its pre-crisis levels, a narrative is circulating that this is a narrow market rally, one where not all boats are lifted with the rising tide of stimulus actions and encouraging health news.
There have been clear winners and losers, as evidenced by sector dispersion that has surpassed Global Financial Crisis (GFC) levels and is now second only to dot-com era heights . However, that does not define the rally as narrow ─ or lacking breadth. It’s necessary to dissect equity performance through many lenses to reveal whether the narrow market narrative is noise or news.
Bad breadth?
Breadth (i.e., how many stocks are participating in a given move) is one way to measure a rally’s voraciousness. A simple measure of breadth is to examine an equal-weighted composition of stocks versus a market cap-weighted composition. Another measure is to compare different market cap ranges (e.g., small vs. large, mid vs. large). If the larger market cap-weighted exposure is the better performer, it can be reasonably understood that the market has weak ─ or bad ─ breadth.
All of this analysis is time dependent, as I am using two dates to capture these returns: the market bottom on 3/24/2020 through Memorial Day. And it must be appreciated that year-to-date, the S&P 500 market cap-weighted version has outpaced its equal-weighted version and traditional mid- and-small-cap exposures across the board, as its drawdown was not as severe. However, the question is not about the narrowness of the year-to-date gains, but rather the rally. And since the market bottom, the S&P 500 has been outpaced by all three, as shown below, with mid caps performing the most strongly.
Market Performance (%)3/24-5/21 PerformanceS&P 500S&P 500 Equal WeightRussell 2000S&P 40002.557.51012.51517.52022.52527.5
Source: Bloomberg Finance L.P. as of 05/21/2020. Past performance is not a guarantee of future results. Figures shown are based on index data and do not assume any fees.
While this may signal that breadth is good, as equal weight is outperforming market cap weight, the differentials are small. And taking a deeper look, we see that over this time period, equal weight outperformed the market cap-weighted S&P 500 on just 45% of the days. It’s difficult to plant a flag on a broad versus narrow recovery with this data. More analysis is needed.
Perhaps the differences can be explained by sectors. To control for sector differences in this basic breadth study of market cap versus equal weight, I analyzed the return differences between a market cap-weighted sector exposure and an equal-weighted sector exposure. If not all boats are rising, then market cap should be outpacing equal weight. As shown below, that is not the case. Only six market cap-weighted sectors are outperforming an equal-weight version. Given that there are 11 sectors, that is roughly an even split. Now, there are some sectors where it is narrow at the top, such as Technology, Communication Services, and Consumer Discretionary. But the best-performing sector during this timeframe ─ Energy ─ saw an equal-weighted version outperform a cap-weighted version at the second-highest rate.
Market Cap Weighted vs. Equal Weighted (3.24-5/21) %Market Cap Weighted vs. Equal Weighted (3/24-5/21)FinancialsEnergyIndustrialsHealth CareUtilitiesCons. StaplesReal EstateMaterialsCons. Disc.Comm. Svcs.Tech.-7-6-5-4-3-2-10123
Source: Bloomberg Finance L.P. as of 05/21/2020. Past performance is not a guarantee of future results. Figures shown are based on index data and do not assume any fees.
Key takeaway: This basic capture of the market’s breadth didn’t answer this question, as the returns are too similar and lack noticeable consistent separation (percent of positive days) or trend among sectors. However, there are sectors that have exhibited a narrower rally than others have.
Top guns or bottom feeders?
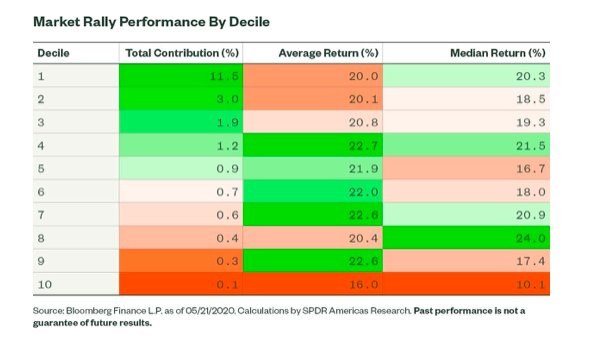
Separating out the S&P 500 by deciles can add more insight. Now, the contribution to return of the top decile will be the largest, as those stocks have the largest weight. That is just math. Using that data point as a rallying cry for a narrow market rally is weak and reveals nothing other than an understanding of basic math. To understand performance trends by market cap, the average and median stock return by decile can be more insightful. As shown below, stocks in decile 1 (the largest market cap) have not had the best returns – both when calculated by taking the average and the median. The middle deciles had the best average returns, while the eighth decile had the strongest median return. The only consistency is that the 10th decile had the worst average and median.
Once again, perhaps sector biases played a part here. To control for this, I analyzed the returns at the sector level, separating stocks into quintiles based on their sector relative market cap (deciles do not make sense, as there are, in some cases, only 30 stocks in a sector). Shown below is the net spread between the average stock return of quintile 1 (high market cap) and quintile 5 (low market cap). The sectors with the largest positive spread (i.e., market cap bested equal weight) are naturally the same ones that saw the market cap-weighted version outpace the equal-weighted version (as shown above) based on actual performance. Consumer Discretionary has the largest spread, given the dispersion among industries within the sector and the presence of Amazon.
Sector Quintile 1 Minus Quintile 5 Performance 3/24-5/21 (%)Quintile 1 Minus Quintile 5EnergyUtilitiesFinancialsHealth CareTech.Comm. Svcs.IndustrialsCons. StaplesReal EstateMaterialsCons. Disc.-15-10-5051015202530
Source: Bloomberg Finance L.P. as of 05/21/2020. Calculations by SPDR Americas Research. Past performance is not a guarantee of future results.
Key takeaway: From a broad-based view, the largest stocks did not always have the best returns. This holds true, to a degree, at the sector level. Some sectors have been powered by strong returns throughout, as the quintile spreads are low. While for other sectors, the big firms have led. Based on this, however, to say that the market is narrow would not be accurate. Is it vastly broad across the market? No, not really, but it is more broad than narrow based on this analysis. Is it narrow for certain sectors? Yes.
I may have an answer, technically speaking
Breadth and return attribution point to a more broad than narrow market rally. The last measurement to examine is how the stocks are trading relative to their own past history, and dissect market technical indicators: percent difference to 52-week high and percent difference to 100-day moving average (this covers the pre- and post-crisis selloff periods). For this, the stocks were once again grouped into deciles. The average and median differences of the indicators were calculated.
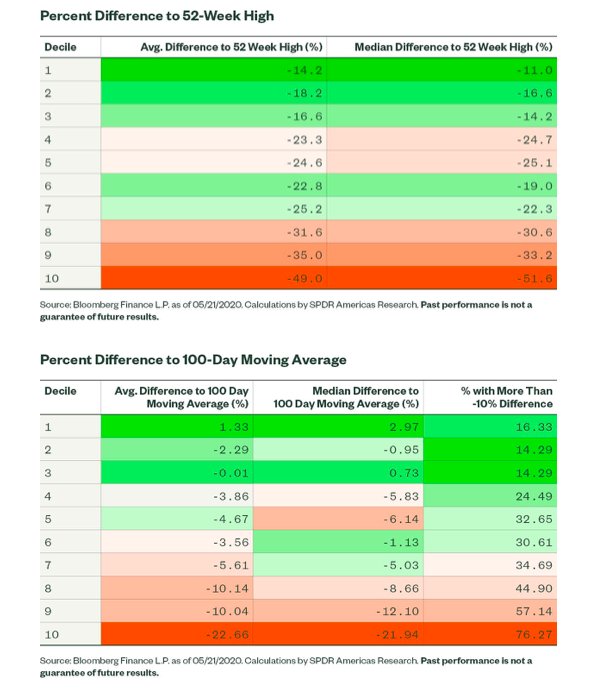
As shown above, this analysis indicates that the bigger stocks, on average, are not as far off their 52-week and 100-day moving averages as smaller stocks are. And more than two-thirds of the stocks in decile 10 are still off 10% or more from their 100-day moving average. Whether it’s median or average, the 10th decile is the worst. But the sixth decile is in a better position when judged by the median difference than some of the higher-weighted deciles, so the results do not fall monotonically from decile 1 to 10.
The figures versus a 200-day moving average are even better for the top deciles relative to the bottom deciles. But again, this is not a surprise, as large stocks did not draw down as much during the selloff. And that is not a fair measurement of the narrowness of a “rally.” On a more short-term indicator, such as the 50-day moving average that covers only the rally periods, the results change, however. The lower-ranked deciles have less of a difference, on average.
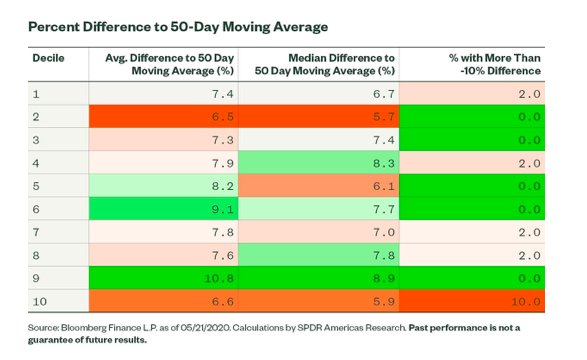
Key takeaway: It is hard to say that the rally is unequivocally narrow. The selloff was not uniform, as larger stocks did not fall as much, reflecting their pricing power and ability to maintain cash flows. As a result, their position versus a long-term technical is stronger. On the way back, given their stronger position and not being so “beaten down,” they have not rallied as much, as shown by using a shorter, 50-day moving average. This may be evidence of broader market participation on the way back, benefited by the fact that the starting point for the bottom decile stocks was so low.
Narrow or broad?
The fact that the case for a clear-cut narrow market is hard to make looking through these three lenses, and that the only piece of information to explicitly hang a narrow hat on is the mathematically explained contribution to return metric, leads me to believe that this rally is more broad than narrow.
I also think investors will see a number of opportunistic buying opportunities as distressed funds are launched. We are engaged in discussions with clients about those possibilities, but there has been little money in motion so far.
To read the rest of this round table interview that first appeared on the SPDR blog on May 27, please click here.
Photo Credit: Peter Addor via Flickr Creative Commons
Disclosure:
Investing involves risk including the risk of loss of principal. The views expressed in this material are subject to change based on market and other conditions. This document contains certain statements that may be deemed forward-looking statements. All statements, other than historical facts, contained within this document that address activities, events or developments that SSGA expects, believes or anticipates will or may occur in the future are forward-looking statements. These statements are based on certain assumptions and analyses made by SSGA in light of its experience and perception of historical trends, current conditions, expected future developments and other factors it believes are appropriate in the circumstances, many of which are detailed herein. Such statements are subject to a number of assumptions, risks, uncertainties, many of which are beyond SSGA’s control. Please note that any such statements are not guarantees of any future performance and that actual results or developments may differ materially from those projected in the forward-looking statements.


