By Marlies Van Boven, managing director, research & analytics
As markets were rattled by the coronavirus pandemic and investors’ risk aversion spiked, how did climate-focused strategies fare?
To answer this question, we take a closer look at the FTSE All-World ex CW Climate Index. The objectives of this index are to: exclude companies that produce controversial weapons, decrease the weight of constituents based on their exposure to fossil fuels or carbon emissions, and increase the weight of constituents with green revenues[1].
We first review the long-term performance of the Index. As the chart below shows, between September 19, 2011 and April 5, 2020, the FTSE All-World ex CW Climate Index has outperformed the FTSE All-World by 3.7%. When we zoom in on the recent market sell-off we notice that the index has marginally outperformed the wider market during the recent period of extreme volatility. What were the drivers behind this performance?
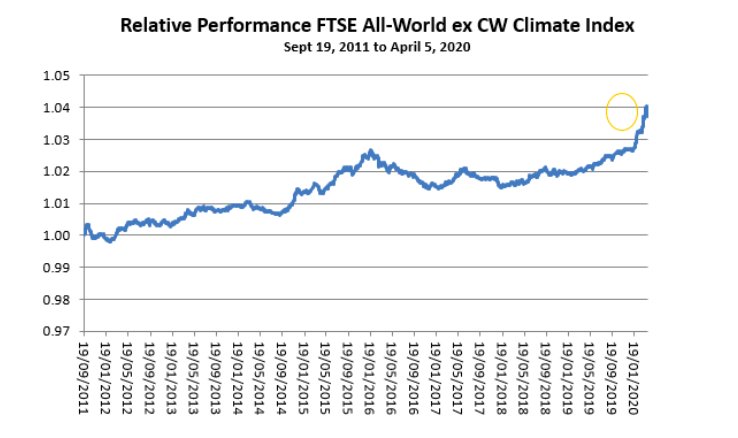
Source: FTSE Russell, data from February 18, 2011 to April 5, 2020. Past performance is no guarantee to future results. Please see the end for important disclosures.
Assessing the impact of Covid-19 on the climate index
We examine the performance of the climate index from the peak to trough of the recent pandemic sell-off. Between February 19 and April 5, the FTSE All-World ex CW Climate Index has marginally outperformed the FTSE All-World by 0.32%. We can look at this from different perspectives, in particular the contribution from factor deviations and active Industry weights.
The index does not have any significant factor exposure and is only slightly tilted to large capitalization, low volatility stocks. Moreover, the Climate Index has a small negative Value exposure resulting from being underweight the Oil & Gas sector (driven by the reduction in fossil fuels exposure).
Investors’ flight to large cap low beta strategies during Q1 2020? caused large swings in the factor returns, benefiting the index 0.34 %. The climate tilts were marginally positive year to date – they added another 0.03% of excess performance.
Table 1. FTSE All-World ex CW Climate Excess Performance Attribution – February 19 to April 5.
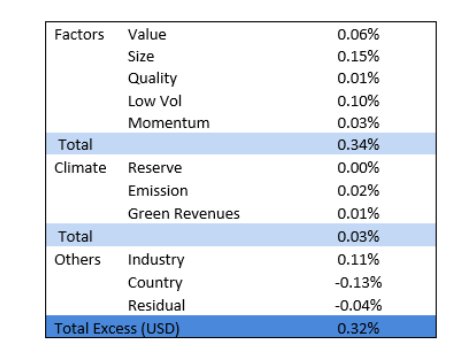
Source: FTSE Russell, data from February 17, 2020 to April 5, 2020. Past performance is no guarantee to future results. Please see the end for important disclosures.
What is the impact of Industry positions on the performance of the indexes?
The largest active Industry weights in the FTSE All-World ex CW Climate Index are in Technology (OW) and Oil & Gas (UW). Being underweight the Oil & Gas sector has particularly benefited the excess performance, contributing 0.15%.
Chart 3. FTSE All-World ex CW Climate: Industry impact on performance
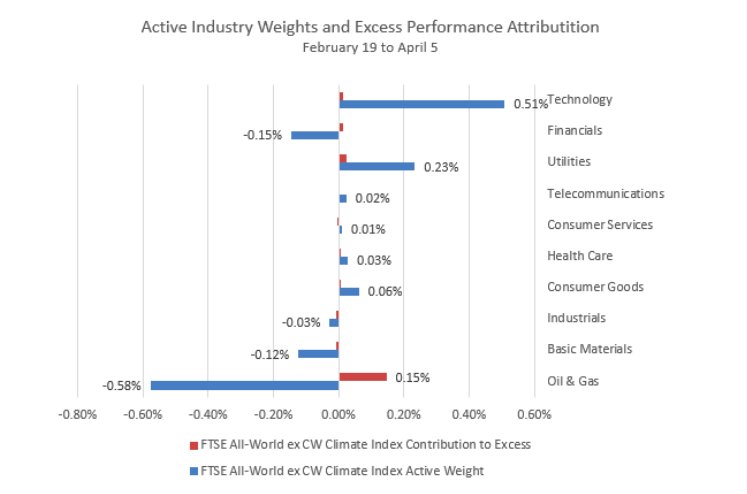
Source: FTSE Russell, data as of April 5, 2020. Past performance is no guarantee to future results. Please see the end for important disclosures.
Takeaway
To conclude the FTSE All-World ex CW Climate Index marginally outperformed during the recent market sell-off. Its strategy is to insulate against climate risks whilst providing exposure to opportunities over the medium to long term. To achieve this, the index underweights stocks with high exposure to fossil fuels and carbon emissions and overweights stocks with revenues from the green economy. Since 2011 this has resulted in almost 400bps of excess return versus the benchmark. So far this year, the resulting overweight in large cap, defensive stocks and underweight in the Oil & Gas sector has delivered a small excess return.
FOOTNOTE
[1]The FTSE Green Revenues Index Series is designed to obtain increased exposure to companies engaged in the transition to a green economy, based on FTSE’s Green Revenues data model, capturing changes in the revenue mix of companies as their business models shift to mitigate or remediate the impacts of climate change, resource depletion and environmental erosion.
Disclosure
© 2020 London Stock Exchange Group plc and its applicable group undertakings (the “LSE Group”). The LSE Group includes (1) FTSE International Limited (“FTSE”), (2) Frank Russell Company (“Russell”), (3) FTSE Global Debt Capital Markets Inc. and FTSE Global Debt Capital Markets Limited (together, “FTSE Canada”), (4) MTSNext Limited (“MTSNext”), (5) Mergent, Inc. (“Mergent”), (6) FTSE Fixed Income LLC (“FTSE FI”), (7) The Yield Book Inc (“YB”) and (8) Beyond Ratings S.A.S. (“BR”). All rights reserved.
FTSE Russell® is a trading name of FTSE, Russell, FTSE Canada, MTSNext, Mergent, FTSE FI, YB and BR. “FTSE®”, “Russell®”, “FTSE Russell®”, “MTS®”, “FTSE4Good®”, “ICB®”, “Mergent®”, “The Yield Book®”, “Beyond Ratings®” and all other trademarks and service marks used herein (whether registered or unregistered) are trademarks and/or service marks owned or licensed by the applicable member of the LSE Group or their respective licensors and are owned, or used under licence, by FTSE, Russell, MTSNext, FTSE Canada, Mergent, FTSE FI, YB or BR. FTSE International Limited is authorised and regulated by the Financial Conduct Authority as a benchmark administrator.
All information is provided for information purposes only. All information and data contained in this publication is obtained by the LSE Group, from sources believed by it to be accurate and reliable. Because of the possibility of human and mechanical error as well as other factors, however, such information and data is provided “as is” without warranty of any kind. No member of the LSE Group nor their respective directors, officers, employees, partners or licensors make any claim, prediction, warranty or representation whatsoever, expressly or impliedly, either as to the accuracy, timeliness, completeness, merchantability of any information or of results to be obtained from the use of FTSE Russell products, including but not limited to indexes, data and analytics, or the fitness or suitability of the FTSE Russell products for any particular purpose to which they might be put. Any representation of historical data accessible through FTSE Russell products is provided for information purposes only and is not a reliable indicator of future performance.
No responsibility or liability can be accepted by any member of the LSE Group nor their respective directors, officers, employees, partners or licensors for (a) any loss or damage in whole or in part caused by, resulting from, or relating to any error (negligent or otherwise) or other circumstance involved in procuring, collecting, compiling, interpreting, analysing, editing, transcribing, transmitting, communicating or delivering any such information or data or from use of this document or links to this document or (b) any direct, indirect, special, consequential or incidental damages whatsoever, even if any member of the LSE Group is advised in advance of the possibility of such damages, resulting from the use of, or inability to use, such information.
No member of the LSE Group nor their respective directors, officers, employees, partners or licensors provide investment advice and nothing contained in this document or accessible through FTSE Russell Indexes, including statistical data and industry reports, should be taken as constituting financial or investment advice or a financial promotion.
Past performance is no guarantee of future results. Charts and graphs are provided for illustrative purposes only. Index returns shown may not represent the results of the actual trading of investable assets. Certain returns shown may reflect back-tested performance. All performance presented prior to the index inception date is back-tested performance. Back-tested performance is not actual performance, but is hypothetical. The back-test calculations are based on the same methodology that was in effect when the index was officially launched. However, back- tested data may reflect the application of the index methodology with the benefit of hindsight, and the historic calculations of an index may change from month to month based on revisions to the underlying economic data used in the calculation of the index.
This publication may contain forward-looking assessments. These are based upon a number of assumptions concerning future conditions that ultimately may prove to be inaccurate. Such forward-looking assessments are subject to risks and uncertainties and may be affected by various factors that may cause actual results to differ materially. No member of the LSE Group nor their licensors assume any duty to and do not undertake to update forward-looking assessments.
No part of this information may be reproduced, stored in a retrieval system or transmitted in any form or by any means, electronic, mechanical, photocopying, recording or otherwise, without prior written permission of the applicable member of the LSE Group. Use and distribution of the LSE Group data requires a licence from FTSE, Russell, FTSE Canada, MTSNext, Mergent, FTSE FI, YB and/or their respective licensors.