By Sandrine Soubeyran and Christine Haggerty, directors, research and analytics
We recently blogged about the negative impact of home bias on equity returns for institutions based in North America, Japan and Australia since the global financial crisis.
Despite decades of collapsing barriers in financial markets, we found institutional investors in almost every market were overweight domestic equities—what’s called home-country bias—resulting in a large underperformance versus a basket of global stocks.
The sole beneficiary of home bias in this period were US institutions, which benefited from the outperformance of US equities and the strength of the US dollar over the 12-year period examined.
Eurozone
Our follow-up paper looks at the Eurozone home bias in equity allocations and demonstrates a similar picture.
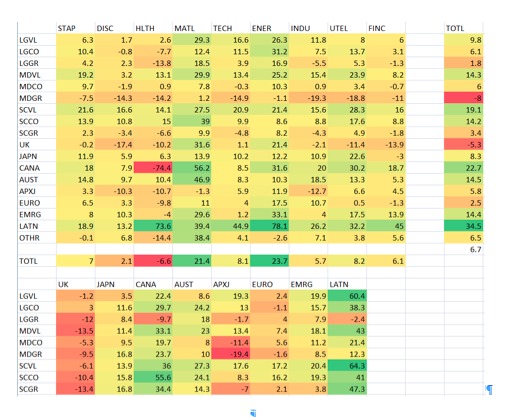
Our research examined the characteristics, performance and return-to-risk profiles of the equity markets in France, Germany, Italy, Netherlands and Spain from 2008 through September 2019, comparing their portfolios with the FTSE All-World Index, which includes large- and mid-cap developed and emerging companies in its representation of the global universe of listed companies.
First, let’s examine the degree of home bias. All five European equity markets examined exhibited favorability to local stocks relative to their weight in the global index. But the degree is remarkable.
Chart 1: Pension funds estimated allocation to local equities relative to total equity exposure and country weight in the FTSE All-World Index (%)
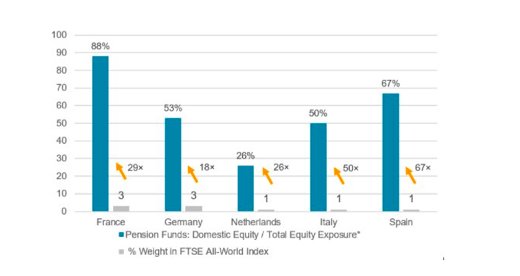
Source: FTSE Russell as of December 31, 2018, and Mercer European Asset Allocation Survey 2018.4
Inward Spain
As chart 1 shows, in the least home-biased market—Germany—the domestic equity allocation was 53%, 18 times the nation’s weight in the FTSE All-World Index index.
The most domestically biased of these markets is Spain, with an average estimated asset allocation of 67%. This is 67 times Spain’s 1% weight in the FTSE All-World. France, The Dutch and Italian pension funds were similarly overweight domestically.
For most of the period, all five markets underperformed their broad international counterparts, with euro weakness and higher stock-market volatility weighed heavily on absolute and risk-adjusted terms. The domestic skew has been extremely costly for investors in these countries.
Chart 2: Relative total returns ‒ FTSE country indices versus the FTSE All-World ex local indices (EUR, rebased)
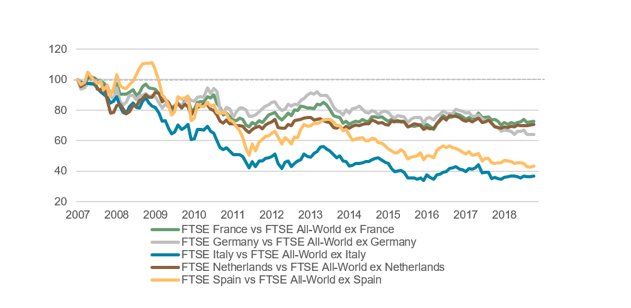
Source: FTSE Russell from December 31, 2007 to September 30, 2019 (Q3 2019). Past performance is no guarantee of future results. Please see the end for important legal disclosures.
Weak Euro
Europe’s difficult decade made local investment bias painful. The multi-year European sovereign-debt crisis took a severe toll on Europe’s peripheral economies and financial markets, notably Italy and Spain.
The weak euro also hurt returns for euro-based investors. And US stock outperformance was a factor: the FTSE USA produced higher risk-adjusted returns than the FTSE All-World ex US in 10 (or more than 80%) of the past 12 years1. Investors underweight US stocks, the engine of global equity performance during the decade, had a tall hurdle to clear.
There are several rationales for investor preference for home markets, including the desire to avoid exposure to exchange rate or political risks, the extra costs to hedge against these risks, regulatory barriers and asset-liability matching needs.
Caveats
And the outcome could have been worse for more bullish investors: pension fund providers in each market tended to allocate less than one third of their overall assets to equities.
These caveats are understandable, but an uncomfortable truth remains: in a decade where Europe’s pension crisis and weak economy were never far from investors’ minds, domestically focused equity strategies tended to deliver significant underperformance compared with more global equity allocation strategies.
Subscribe to our blog
1Source: Appraising home bias exposure using the FTSE Global Equity Index Series (FTSE GEIS), FTSE Russell, October 2019:
This article first appeared on January 28 on the FTSE Russell blog
Photo Credit: Tomasz Baranowski via Flickr Creative Commons
© 2020 London Stock Exchange Group plc and its applicable group undertakings (the “LSE Group”). The LSE Group includes (1) FTSE International Limited (“FTSE”), (2) Frank Russell Company (“Russell”), (3) FTSE Global Debt Capital Markets Inc. and FTSE Global Debt Capital Markets Limited (together, “FTSE Canada”), (4) MTSNext Limited (“MTSNext”), (5) Mergent, Inc. (“Mergent”), (6) FTSE Fixed Income LLC (“FTSE FI”), (7) The Yield Book Inc (“YB”) and (8) Beyond Ratings S.A.S. (“BR”). All rights reserved.
FTSE Russell® is a trading name of FTSE, Russell, FTSE Canada, MTSNext, Mergent, FTSE FI, YB and BR. “FTSE®”, “Russell®”, “FTSE Russell®”, “MTS®”, “FTSE4Good®”, “ICB®”, “Mergent®”, “The Yield Book®”, “Beyond Ratings®” and all other trademarks and service marks used herein (whether registered or unregistered) are trademarks and/or service marks owned or licensed by the applicable member of the LSE Group or their respective licensors and are owned, or used under licence, by FTSE, Russell, MTSNext, FTSE Canada, Mergent, FTSE FI, YB or BR. FTSE International Limited is authorised and regulated by the Financial Conduct Authority as a benchmark administrator.
All information is provided for information purposes only. All information and data contained in this publication is obtained by the LSE Group, from sources believed by it to be accurate and reliable. Because of the possibility of human and mechanical error as well as other factors, however, such information and data is provided “as is” without warranty of any kind. No member of the LSE Group nor their respective directors, officers, employees, partners or licensors make any claim, prediction, warranty or representation whatsoever, expressly or impliedly, either as to the accuracy, timeliness, completeness, merchantability of any information or of results to be obtained from the use of FTSE Russell products, including but not limited to indexes, data and analytics, or the fitness or suitability of the FTSE Russell products for any particular purpose to which they might be put. Any representation of historical data accessible through FTSE Russell products is provided for information purposes only and is not a reliable indicator of future performance.
No responsibility or liability can be accepted by any member of the LSE Group nor their respective directors, officers, employees, partners or licensors for (a) any loss or damage in whole or in part caused by, resulting from, or relating to any error (negligent or otherwise) or other circumstance involved in procuring, collecting, compiling, interpreting, analysing, editing, transcribing, transmitting, communicating or delivering any such information or data or from use of this document or links to this document or (b) any direct, indirect, special, consequential or incidental damages whatsoever, even if any member of the LSE Group is advised in advance of the possibility of such damages, resulting from the use of, or inability to use, such information.
No member of the LSE Group nor their respective directors, officers, employees, partners or licensors provide investment advice and nothing contained in this document or accessible through FTSE Russell Indexes, including statistical data and industry reports, should be taken as constituting financial or investment advice or a financial promotion.
Past performance is no guarantee of future results. Charts and graphs are provided for illustrative purposes only. Index returns shown may not represent the results of the actual trading of investable assets. Certain returns shown may reflect back-tested performance. All performance presented prior to the index inception date is back-tested performance. Back-tested performance is not actual performance, but is hypothetical. The back-test calculations are based on the same methodology that was in effect when the index was officially launched. However, back- tested data may reflect the application of the index methodology with the benefit of hindsight, and the historic calculations of an index may change from month to month based on revisions to the underlying economic data used in the calculation of the index.
This publication may contain forward-looking assessments. These are based upon a number of assumptions concerning future conditions that ultimately may prove to be inaccurate. Such forward-looking assessments are subject to risks and uncertainties and may be affected by various factors that may cause actual results to differ materially. No member of the LSE Group nor their licensors assume any duty to and do not undertake to update forward-looking assessments.
No part of this information may be reproduced, stored in a retrieval system or transmitted in any form or by any means, electronic, mechanical, photocopying, recording or otherwise, without prior written permission of the applicable member of the LSE Group. Use and distribution of the LSE Group data requires a licence from FTSE, Russell, FTSE Canada, MTSNext, Mergent, FTSE FI, YB and/or their respective licensors.