By Rolf Agather, managing director of research, North America, FTSE Russell
The findings of our latest annual global survey of smart beta usage by asset owners (with a collective AUM of over $5 trillion), suggests that smart beta is now a standard tool in investors’ armories.
For the first time, we found that the majority of asset owners—government organizations, corporations, unions, insurance companies, sovereign wealth funds and family offices from North America, Europe, Asia Pacific and elsewhere—now allocate to smart beta.
Here are five key findings from the report. (Download the report here)
1. Asset owners in the survey not deploying smart beta are now in the minority
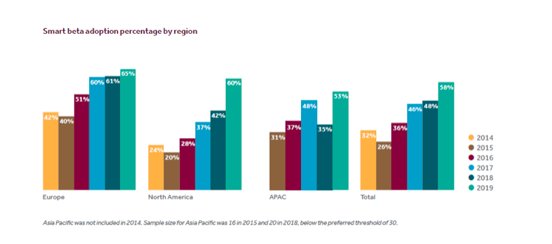
Global adoption of smart beta has doubled in four years. Fifty-eight percent of asset owners now have an allocation to a smart beta strategy, compared to 26 percent in 2015, when a downturn in adoption compared with our first survey a year earlier appeared to suggest that the strategy might fail to take off.
Since then, adoption of smart beta has risen consistently. Geographically, nearly two-thirds (65 percent) of European asset owners now have a smart beta exposure, versus 60 percent in North America. In our first survey back in 2014, only 42 percent of European respondents had adopted smart beta, and less than one third (32 percent) of North American respondents had adopted it.
An attitudinal watershed also appears to have been reached: only six percent of asset owners had recently evaluated and then rejected smart beta strategies, compared with nearly one quarter (23 percent) in 2015.
2. Investors are combining ESG and smart beta, but growth is not uniform
Three years ago, we started asking questions about applying ESG considerations to smart beta strategies. Interest is rising among those respondents who are using or evaluating smart beta, and 44 percent said they anticipate applying ESG considerations to their smart beta strategy.
We’ve again seen a growth in appetite for Smart Sustainability—combining sustainability parameters and risk premia, for example, via factor exposure, within a single index solution. This reflects the growing demand for the incorporation of both factors and Environmental, Social, and Governance (ESG) data into investment tools, including indexes.
But there are pronounced regional differences in the responses, most notably between respondents based in Europe and North America. For European survey respondents who either had an existing or anticipated smart beta allocation, 77% said they might incorporate ESG considerations into that allocation. However, only 17 percent of North American survey respondents with an existing or anticipated future smart beta allocation gave the same response.
3. The appetite for multi-factor strategies is rising
In our first survey of 2014, multi-factor strategies were so new, they didn’t even feature. Now they account for the highest number of new smart beta adoptions. There has been an adoption surge in the last year: less than half (49 percent) of respondents were using multi-factor strategies in 2018, compared to 71 percent this time round.
For the first time new smart beta users were more likely to choose a multi-factor approach than any other. This adoption rate is even more apparent when we look at the North American asset owners’ experience. Our data shows that usage there now stands at 80 percent.
4. Size is no longer a deterrent
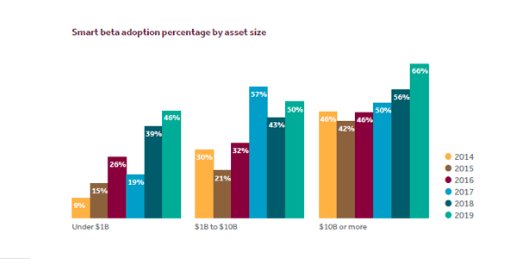
Smaller asset owners are also embracing smart beta. In our inaugural survey six years ago, the largest asset owners were five times more likely to have adopted smart beta strategies than those with AUM less than $1B.
In that year, fewer than one in 10 small asset owners were users of smart beta strategies: now 46 percent are users. But the adoption gap has narrowed in the years since, and the greatest change in adoption rates has taken place in the under $1B tier.
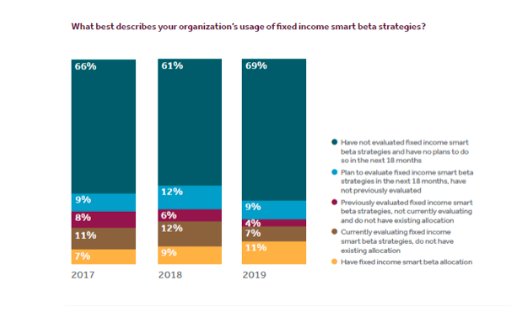
5. Fixed income: mind the gap
The pattern of adoption of smart beta strategies might replicate the path of passive investment adoption, where fixed income passive fund growth only followed in the wake of the rise of passive equity AUM. But that is by no means a given, and the important questions investors raised in the survey would need to be addressed first.
Overall, fixed income smart beta adoption rates have risen but are still minimal by comparison, and we found that there is no one single barrier to entry. This suggests a general unfamiliarity with the strategy, rather than a specific hurdle.
Lack of resources, enduring faith in active, lack of product, and the absence of consultant support were all cited as reasons for having not yet adopted fixed income smart beta strategies.
Takeaway
Overall, it now seems unequivocal that investors have truly embraced smart beta, and skepticism that it would remain niche have faded. But investors are still asking detailed questions about its use beyond equities, and in particular, in conjunction with ESG strategies.
*For the purposes of the survey we defined “smart beta” as an investment strategy that applied an index-based approach that is not traditionally market cap-weighted.
Photo Credit: 401(K) 2012 via Flickr Creative Commons
This article first appeared on the FTSE Russell blog on June 13.
© 2019 London Stock Exchange Group plc and its applicable group undertakings (the “LSE Group”). The LSE Group includes (1) FTSE International Limited (“FTSE”), (2) Frank Russell Company (“Russell”), (3) FTSE Global Debt Capital Markets Inc. and FTSE Global Debt Capital Markets Limited (together, “FTSE Canada”), (4) MTSNext Limited (“MTSNext”), (5) Mergent, Inc. (“Mergent”), (6) FTSE Fixed Income LLC (“FTSE FI”) and (7) The Yield Book Inc (“YB”). All rights reserved.
FTSE Russell® is a trading name of FTSE, Russell, FTSE Canada, MTSNext, Mergent, FTSE FI, YB. “FTSE®”, “Russell®”, “FTSE Russell®”, “MTS®”, “FTSE4Good®”, “ICB®”, “Mergent®”, “The Yield Book®” and all other trademarks and service marks used herein (whether registered or unregistered) are trademarks and/or service marks owned or licensed by the applicable member of the LSE Group or their respective licensors and are owned, or used under licence, by FTSE, Russell, MTSNext, FTSE Canada, Mergent, FTSE FI, YB. FTSE International Limited is authorised and regulated by the Financial Conduct Authority as a benchmark administrator.
All information is provided for information purposes only. All information and data contained in this publication is obtained by the LSE Group, from sources believed by it to be accurate and reliable. Because of the possibility of human and mechanical error as well as other factors, however, such information and data is provided “as is” without warranty of any kind. No member of the LSE Group nor their respective directors, officers, employees, partners or licensors make any claim, prediction, warranty or representation whatsoever, expressly or impliedly, either as to the accuracy, timeliness, completeness, merchantability of any information or of results to be obtained from the use of FTSE Russell indexes or research or the fitness or suitability of the FTSE Russell indexes or research for any particular purpose to which they might be put. Any representation of historical data accessible through FTSE Russell indexes or research is provided for information purposes only and is not a reliable indicator of future performance.
No responsibility or liability can be accepted by any member of the LSE Group nor their respective directors, officers, employees, partners or licensors for (a) any loss or damage in whole or in part caused by, resulting from, or relating to any error (negligent or otherwise) or other circumstance involved in procuring, collecting, compiling, interpreting, analysing, editing, transcribing, transmitting, communicating or delivering any such information or data or from use of this blog or links to this blog or (b) any direct, indirect, special, consequential or incidental damages whatsoever, even if any member of the LSE Group is advised in advance of the possibility of such damages, resulting from the use of, or inability to use, such information.
No member of the LSE Group nor their respective directors, officers, employees, partners or licensors provide investment advice and nothing contained in this blog or accessible through FTSE Russell indexes or research, including statistical data and industry reports, should be taken as constituting financial or investment advice or a financial promotion.
No part of this information may be reproduced, stored in a retrieval system or transmitted in any form or by any means, electronic, mechanical, photocopying, recording or otherwise, without prior written permission of the applicable member of the LSE Group. Use and distribution of the LSE Group data requires a licence from FTSE, Russell, FTSE Canada, MTSNext, Mergent, FTSE FI, YB, and/or their respective licensors.