

The stock market carnage has been fast and furious in October with wild market swings and plenty of volatility.
The sharp-eyed analysts at Bespoke Investment Group have pulled together some remarkable charts that tell the story.

Let’s start with the Russell 3000, an index that tracks the performance of 3,000 of the largest traded stocks in the U.S. and 98% of all equity securities.
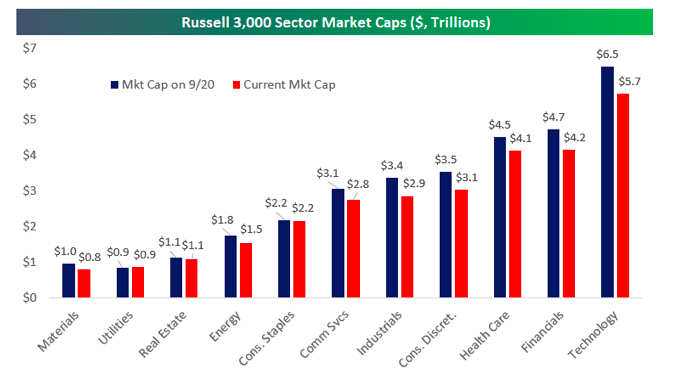
It has taken a massive, multi-trillion dollar hit since late September, or as Bespoke explains:
“Since the US stock market peaked on a closing basis back on September 20th, Russell 3,000 stocks have collectively lost roughly $3.5 trillion in market cap. Breaking the losses down by market cap, the 50 largest stocks in the US have lost roughly $1.25 trillion in market cap, while the 2,000 smallest have lost $350 billion.”
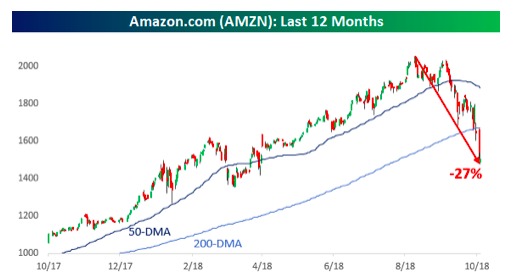
Amazon
On an individual stock basis, Amazon (AMZN) has suffered the biggest nominal lost in market capitalization.
Its stock has fallen 27% over the past 12 months and has shed $195 billion since the last market peak in on September 29.
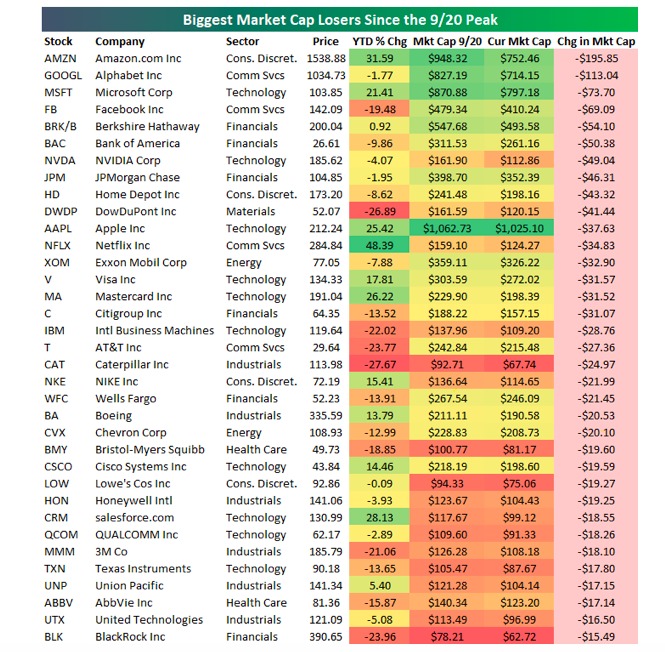
Tech Sector
In fact, if you look at the biggest decliners in market value since September 29, four out of the top five are tech companies: Amazon, Alphabet (GOOGL), Microsoft (MSFT) and Facebook (FB).
Big money center banks like JPMorgan (JPM) and Bank of America (BAC) have also taken hits to their market value.
Takeaway
It has been a real roller coaster ride for investors in recent weeks.
While the bull market that started in March of 2009 is a historic one, in my view, all stock rallies end at some point.
Whether we’ve reached that inflection point in late 2018 remains a burning question for investors, in my opinion.
Photo Credit: Patrick Gruban via Flickr Creative Commons


