

The mistake people make in trying to use technical analysis is that they assume that somehow a chart magically alerts the follower as to when to buy or sell. That is simply wishful thinking. What technical analysis does is give us a picture of investors’ psychology. Taken a step further, a good technical analyst (more likely a good computer program) can tell that when investors’ psychology is at a certain point as measured by a technical indicator, the market, more often than not, reacts in a given way.
But we humans are fickle. Sometimes when we are depressed we react by eating a gallon of ice cream. Other times, by going to the gym and getting the endorphins going. But what a technical analysis–or Google (GOOG) or Facebook (FB)–would do is know that more often than not we choose one activity over the other.
Facebook reacts by placing ads for Ben and Jerry’s on your Facebook page. A technical investor reacts by buying or selling a security based on the history of an indicator. Not that either are right all the time, but if applied consistently, in theory, both Facebook and the investor can potentially take advantage of human behavior patterns.
I bring this up because I saw two interesting patterns this morning as I was looking over the carnage from last week. The first is for Prospect Capital Corp. (NASDAQ: PSEC), a business development company. A little background. Business development companies (BDCs) help small companies in early stages of development (similar to venture capital firms).
They have been around in the US since 1980 when Congress amended the Investment Company Act of 1940. The amendment essentially gave individual investors the opportunity to invest in a publicly-traded private-equity firm. The tax structure is similar to a real estate investment trust (REIT), in that if the company meets certain requirements, it pays little income tax. However, the company then must return a minimum of 90% of taxable income as dividends.
Simply put, BDC’s derive most of their revenue from borrowing money at their lower rate and then lending money to the smaller companies at a higher rate. Their profits, and thus their dividends, are dependent on this spread. So the thinking goes that with rising interest rates the BDC’s spread in interest rates will shrink – as will their profits and dividends. Along with utilities and REITs, BDC’s have been hit pretty hard since the start of May when rising rate jitters infected the markets.
My purpose is to try and see what investor psychology is telling us about last week’s selloff; was it just liquidity driven as leveraged investment funds sought to reduce leverage, or do investors see this as a longer term secular move? Looking at the chart of PSEC, below, I noticed the last two candles highlighted by arrows.
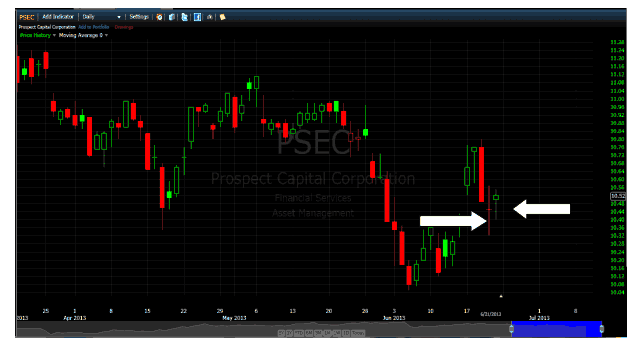
The first for Thursday, June 20th, is a spinning top. It is characterized by the long “strings”, both above and below the body. The strings represent the stock’s price during the trading session. The body indicates the open and closing price. What we see is classic struggle between buyers and sellers, where no one won. During the day, relatively large price swings, but by the end of the day, very little net movement from opening to close. This is a classic case of investor indecision.
On Friday we see a “doji” or hammer candle. The doji has a long string to the bottom, with a relatively small head toward the top. Net, PSEC finished positive on the day. The candle formation tells us that during the day, sentiment was fairly negative. However, by the end of the day, the price finished positively. This is frequently interpreted as a positive, or a turnaround indicator from prior negative trading days.
What I find interesting, is after a horrible, solid, down day on Wednesday, investors first reacted with indecision, (spinning top) followed by an optimistic close (the doji). Since the only news that mattered last week was the Fed meeting and the discussion about “tapering”, I see this as a positive sign for the market in the short run.
Investors, after the typical overreaction to news, sat back, thought about it, and decided that rising interest rates aren’t the fear that they were being made out to be…at least for two days! Would I use these as trading signals, and buy at the open Monday morning? Probably not, but a little insight into investor psychology has made my weekend a little less stressful.
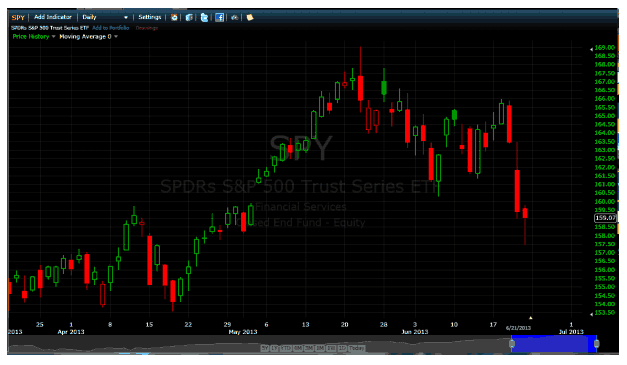
Before closing, let’s take a quick look at the overall market by looking at a chart of (SPY), the SPDR S&P 500 ETF. Clearly there was no such indecision on Thursday for investors in SPY. As evidenced from the long red body of Thursday’s candle, the market went down, stayed down, and finished near the lows of the day. However, on Friday we see another doji formation. While SPY finished negative, it finished well off its lows for the day, showing a bit of optimism going into the close…and more importantly into the weekend.
Conclusion
While my scan of the market will include many more securities, what the candle stick charts are showing me is that this does not look to be a market in free fall. Investors are pausing and reflecting before making their next move. Based on PSEC, and similar formations in other dividend paying stocks it looks like some investors are concluding that the interest rate sell off may be over blown, and money wants to return to the dividend sector of the market.
Disclosure: Bill DeShurko is currently long the Prospect Capital Corp. (NASDAQ: PSEC), a business development company stock. Any investments discussed in this publication are for illustrative purposes only. The opinions and views expressed herein are of the portfolio manager and may differ from other managers, or the firm as a whole. All investments involve risk (the amount of which may vary significantly) and investment recommendations will not always be profitable. Past performance does not guarantee future results.


