

By Mark Barnes, head of investment research (Americas), and Christine Haggerty, research & analytics
Amid the widespread stock-market wreckage arising from the Russian-Ukraine conflict in February, there was one notable survivor: US small caps actually posted gains for the month, eclipsing the broad US market and most markets elsewhere.
This resilience is particularly striking given its prolonged losing streak for most of the past year as market leadership rotated away from cyclical, value-oriented stock groups toward more growth-centric segments.
Despite its standout showing in February, particularly versus the broad US and European indexes (see chart below), the Russell 2000 remains among the worst performers for the past three months and longer-term.
While it’s still early days, it can be instructive to understand what’s behind this turnaround and what it may be signaling about investor sentiment going forward.
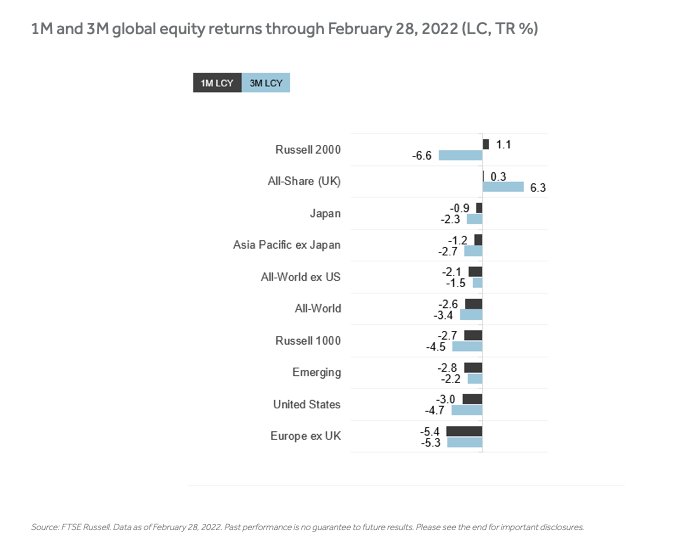
Source: FTSE Russell. Data as of February 28, 2022.
Energy stocks
Parsing Industry Classification Benchmark (ICB) data revealed two obvious sources of the US small-cap index’s firepower in February: its overweight in energy stocks, which leapt nearly 8% in the US last month amid growing risks to supplies from the Russia-Ukraine war, and its underweight in technology, which posted the biggest losses.
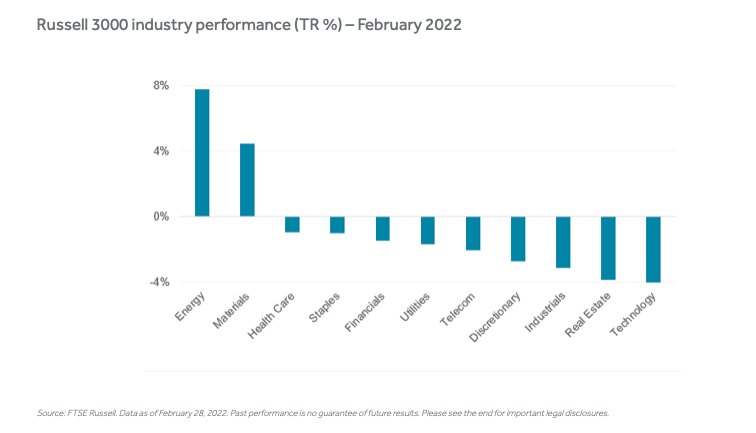
Source: FTSE Russell. Data as of February 28, 2022.
As shown below, oil, gas & coal stocks accounted for more than half of Russell 2000’s monthly returns, double the sector’s contribution to the Russell 1000, while technology software and hardware stocks were far less of a drag on Russell 2000 returns.
Contributions from smaller stocks within financials (i.e., banks), health care (i.e., medical equipment) and basic materials (i.e., industrial metals) also helped.
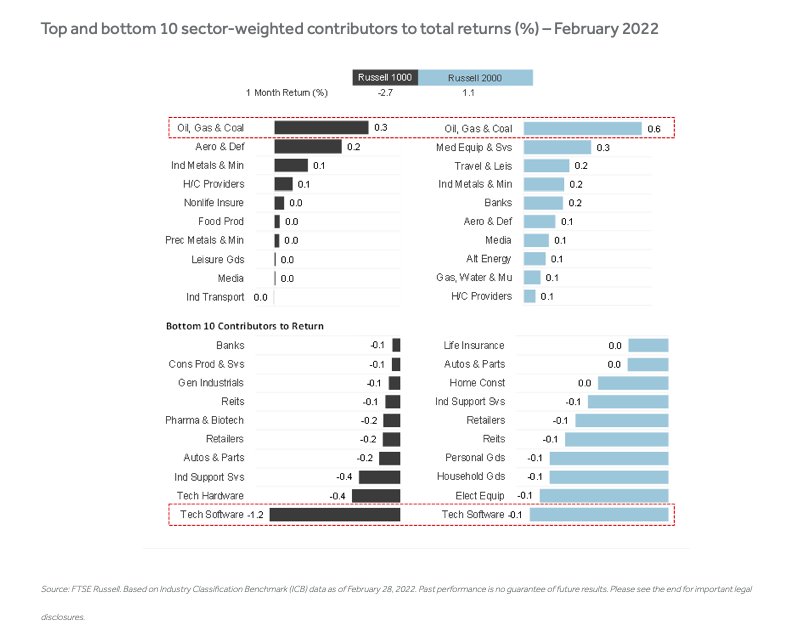
Source: FTSE Russell. Based on Industry Classification Benchmark (ICB) data as of February 28, 2022.
Macro Dynamics
Small-cap companies typically derive more of their revenues domestically and, thus, are likely to be more immune than their larger multinational peers to the havoc being wreaked on global commerce by the Ukraine crisis and financial sanctions on Russia.
The small-cap index also tilts more to cyclical industries, which stand to benefit from the strength in US jobs, wages and consumer spending as the post-pandemic recovery continues. Though the onset of Fed tightening regime poses a potential headwind, small stocks have typically done well if interest rates rise in response to a strengthening economy.
The forthcoming rollout of federal spending from the $1.2 trillion infrastructure bill passed last November, which favors industries more greatly represented in the small-cap index, such as industrials, energy and basic materials. (Each outweighs their share of the Russell 1000 by two percentage points.)
Relative valuations may be another factor underpinning recent small-cap outperformance: the 12-month forward P/E for the Russell 2000 has fallen far more steeply than the large-cap index since peaking in mid-2020 on pandemic-depressed earnings, and are currently near the lowest level of the past five years. Its premium to the Russell 1000 has also narrowed significantly, despite expectations for far faster earnings growth. Specifically, consensus forecasts look for Russell 2000 EPS to grow nearly 28% this year, compared to 10% for the Russell 1000.
This post first appeared on March 8 on the FTSE Russell blog.
Photo Credit: Susanne Nilsson via Flickr Creative Commons
All information is provided for information purposes only. All information and data contained in this publication is obtained by the LSE Group, from sources believed by it to be accurate and reliable. Because of the possibility of human and mechanical error as well as other factors, however, such information and data is provided “as is” without warranty of any kind. No member of the LSE Group nor their respective directors, officers, employees, partners or licensors make any claim, prediction, warranty or representation whatsoever, expressly or impliedly, either as to the accuracy, timeliness, completeness, merchantability of any information or of results to be obtained from the use of FTSE Russell products, including but not limited to indexes, data and analytics, or the fitness or suitability of the FTSE Russell products for any particular purpose to which they might be put. Any representation of historical data accessible through FTSE Russell products is provided for information purposes only and is not a reliable indicator of future performance.
The Russell 2000 and Russell 1000 are stock indexes that cover a variety of companies and industries. Investors can’t invest directly into indexes.
No responsibility or liability can be accepted by any member of the LSE Group nor their respective directors, officers, employees, partners or licensors for (a) any loss or damage in whole or in part caused by, resulting from, or relating to any error (negligent or otherwise) or other circumstance involved in procuring, collecting, compiling, interpreting, analysing, editing, transcribing, transmitting, communicating or delivering any such information or data or from use of this document or links to this document or (b) any direct, indirect, special, consequential or incidental damages whatsoever, even if any member of the LSE Group is advised in advance of the possibility of such damages, resulting from the use of, or inability to use, such information.

