By Mark Barnes, head of investment research, Americas
When we first developed the Russell Style Indexes, their primary objective was to provide appropriate benchmarks for active asset managers. But investors soon discovered growth and value indexes could be useful for other purposes—such as the basis for passive investments or as tools for implementing tactical style tilts.
With 40 years of Russell Style Index performance history now in the rearview, we can observe several distinct cycles of style rotation over the past several decades, as detailed in our research paper. And for investors looking to express tactical views on the timing of these shifts, Russell Style Indexes are designed to be valuable implementation tools.
Growth and value
We construct Russell Style Indexes by dividing the Russell 1000 and Russell 2000 equally by market value into growth and value stocks. As such, by design the Russell 1000 and Russell 2000 Growth and Value Indexes represent half of their parent indexes.
As shown below, this symmetry is evident when comparing style index annualized 3-year rolling excess returns relative to their parent indexes. What’s also noteworthy about the below chart is the clear cyclicality of growth and value relative performance, where the Russell 1000 Growth and Russell 1000 Value have cycled in and out of relative favor over the past 40 years.
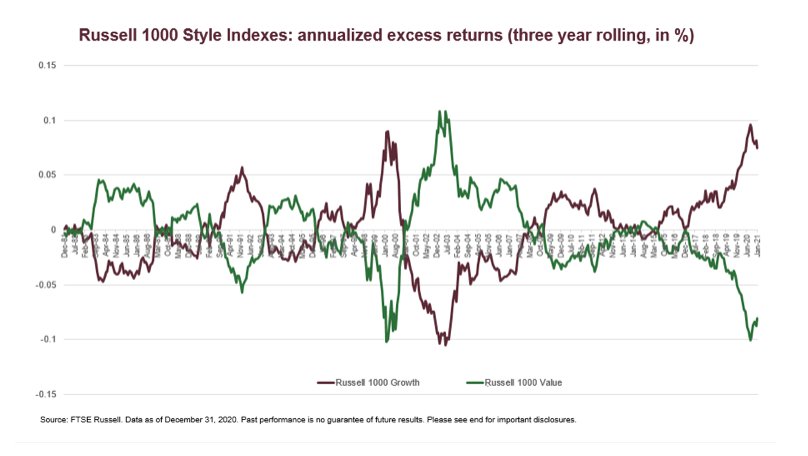
It should perhaps come as no surprise that the most pronounced cycle in this chart was during the late 1990s tech bubble, when growth stock returns initially soared relative to value—and then abruptly plummeted when the bubble burst. However, the onset of the Great Financial Crisis later reversed this trend, though to a lesser extent until more recently, when the COVID-19 crisis spurred a period of stronger growth outperformance.
Strategic Tilting
The emergence of COVID-19 vaccines has sparked hopes that a return to a more normal environment could be in the not-so-distant future. This has some investors wondering whether a market rotation toward value might be on the horizon—and whether to implement a tactical style tilt to express this view.
For investors contemplating a style rotation, Russell Style Indexes can be an easy, transparent way to track these styles. We’ve refined the construction methodology for these indexes over time such that they’re an objective, complete representation of the growth and value composition of their parent indexes. The Russell growth and value indexes always sum up to the overall market—making them a precise and fully transparent tool for strategic style tilts.
For example, an investor who believes value will outperform can tactically deviate from a 50-50 growth/value policy benchmark by allocating 55% to value and 45% to growth. The investor can implement these shifts either with passive investments using the style indexes as the basis, or by using the indexes as benchmarks for active manager allocations. In either case, the transparency and modularity of the Russell Style Indexes have lent them enduring utility for expressing tactical views.
This post first appeared on Feb. 24 on the FTSE Russell blog.
Photo Credit: Ishtaure Dawn via Flickr Creative Commons
© 2021 London Stock Exchange Group plc and its applicable group undertakings (the “LSE Group”). The LSE Group includes (1) FTSE International Limited (“FTSE”), (2) Frank Russell Company (“Russell”), (3) FTSE Global Debt Capital Markets Inc. and FTSE Global Debt Capital Markets Limited (together, “FTSE Canada”), (4) MTSNext Limited (“MTSNext”), (5) Mergent, Inc. (“Mergent”), (6) FTSE Fixed Income LLC (“FTSE FI”), (7) The Yield Book Inc (“YB”) and (8) Beyond Ratings S.A.S. (“BR”). All rights reserved.
FTSE Russell® is a trading name of FTSE, Russell, FTSE Canada, MTSNext, Mergent, FTSE FI, YB and BR. “FTSE®”, “Russell®”, “FTSE Russell®”, “MTS®”, “FTSE4Good®”, “ICB®”, “Mergent®”, “The Yield Book®”, “Beyond Ratings®” and all other trademarks and service marks used herein (whether registered or unregistered) are trademarks and/or service marks owned or licensed by the applicable member of the LSE Group or their respective licensors and are owned, or used under licence, by FTSE, Russell, MTSNext, FTSE Canada, Mergent, FTSE FI, YB or BR. FTSE International Limited is authorised and regulated by the Financial Conduct Authority as a benchmark administrator.
The Russell 3000 Index is a capitalization-weighted stock market index, maintained by FTSE Russell, that seeks to be a benchmark of the entire U.S stock market.
The Russell 1000 Index is a stock market index that tracks the highest-ranking 1,000 stocks in the Russell 3000 Index, which represent about 90% of the total market capitalization of that index.
The Russell Style Indexes are constructed by dividing the Russell 1000 and Russell 2000 equally by market value into growth and value stocks. As such, by design the Russell 1000 and Russell 2000 Growth and Value Indexes represent half of their parent indexes. Investor’s can’t invest directly into indexes.
All information is provided for information purposes only. All information and data contained in this publication is obtained by the LSE Group, from sources believed by it to be accurate and reliable. Because of the possibility of human and mechanical error as well as other factors, however, such information and data is provided “as is” without warranty of any kind. No member of the LSE Group nor their respective directors, officers, employees, partners or licensors make any claim, prediction, warranty or representation whatsoever, expressly or impliedly, either as to the accuracy, timeliness, completeness, merchantability of any information or of results to be obtained from the use of FTSE Russell products, including but not limited to indexes, data and analytics, or the fitness or suitability of the FTSE Russell products for any particular purpose to which they might be put. Any representation of historical data accessible through FTSE Russell products is provided for information purposes only and is not a reliable indicator of future performance.
No responsibility or liability can be accepted by any member of the LSE Group nor their respective directors, officers, employees, partners or licensors for (a) any loss or damage in whole or in part caused by, resulting from, or relating to any error (negligent or otherwise) or other circumstance involved in procuring, collecting, compiling, interpreting, analysing, editing, transcribing, transmitting, communicating or delivering any such information or data or from use of this document or links to this document or (b) any direct, indirect, special, consequential or incidental damages whatsoever, even if any member of the LSE Group is advised in advance of the possibility of such damages, resulting from the use of, or inability to use, such information.
No member of the LSE Group nor their respective directors, officers, employees, partners or licensors provide investment advice and nothing contained in this document or accessible through FTSE Russell Indexes, including statistical data and industry reports, should be taken as constituting financial or investment advice or a financial promotion.
Past performance is no guarantee of future results. Charts and graphs are provided for illustrative purposes only. Index returns shown may not represent the results of the actual trading of investable assets. Certain returns shown may reflect back-tested performance. All performance presented prior to the index inception date is back-tested performance. Back-tested performance is not actual performance, but is hypothetical. The back-test calculations are based on the same methodology that was in effect when the index was officially launched. However, back- tested data may reflect the application of the index methodology with the benefit of hindsight, and the historic calculations of an index may change from month to month based on revisions to the underlying economic data used in the calculation of the index.
This publication may contain forward-looking assessments. These are based upon a number of assumptions concerning future conditions that ultimately may prove to be inaccurate. Such forward-looking assessments are subject to risks and uncertainties and may be affected by various factors that may cause actual results to differ materially. No member of the LSE Group nor their licensors assume any duty to and do not undertake to update forward-looking assessments.
No part of this information may be reproduced, stored in a retrieval system or transmitted in any form or by any means, electronic, mechanical, photocopying, recording or otherwise, without prior written permission of the applicable member of the LSE Group. Use and distribution of the LSE Group data requires a licence from FTSE, Russell, FTSE Canada, MTSNext, Mergent, FTSE FI, YB and/or their respective licensors.