By Mark Barnes, head of investment research (Americas) and Marlies van Boven, head of investment research (EMEA)
The Value factor has underperformed globally for the past 14 years, prompting some even to wonder if Value is ‘dead’. But, as our research shows, the factor’s behavior has varied starkly across equity markets and time. These differences offer clues to potential catalysts that could fuel a Value revival.
For most of the post-GFC era, Value has suffered a structural double whammy from its large overweight to badly lagging financial stocks and underweight to highflying technology stocks prized for their reliable growth prospects, particularly in the US.
This year, as the COVID-19 crisis unfolded, Value’s overweight to oil, especially in the UK, and underweight to outperforming health care added to its woes. Overall, financials, oil and other deep-cyclical sectors have languished in the ‘low-growth, low-yield’ environment that has prevailed for most of the past decade or so.
November shows how quickly market preferences can turn
But Value’s fortunes made a dramatic U-turn in November. News of several vaccine breakthroughs ignited hopes for a stronger global economic recovery and reflation, driving robust Value outperformance in most markets (except Japan). Value did particularly well in the UK, where it beat the market by 4.9 percentage points, and in Europe ex UK, where outperformed by 4 points.
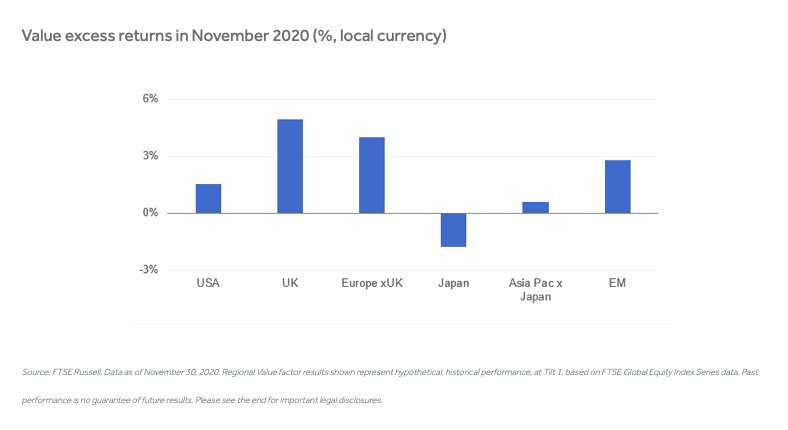
Source: FTSE Russell. Data as of November 30, 2020. Regional Value factor results shown represent hypothetical, historical performance, at Tilt 1, based on FTSE Global Equity Index Series data. Past performance is no guarantee of future results. Please see the end for important legal disclosures.
As we wrote in an earlier blog, Value’s banner November came alongside a massive rotation away from the long-time growth winners, dominated by Internet platform giants and other beneficiaries of COVID-19 social restrictions, into many of the pandemic-stricken cyclical industries that typically are the first to recover as an economy pulls out of recession. These include oil & gas companies, which stand to benefit from stronger demand and higher prices. Financials, notably banks, also rank as major beneficiaries, as higher interest rates (and steepening yield curves) bolster their profitability.
We see the impact of this shift in the chart below, which shows the industry allocation contribution effect, or the effect of using Value to allocate to cap-weighted industries, in November.
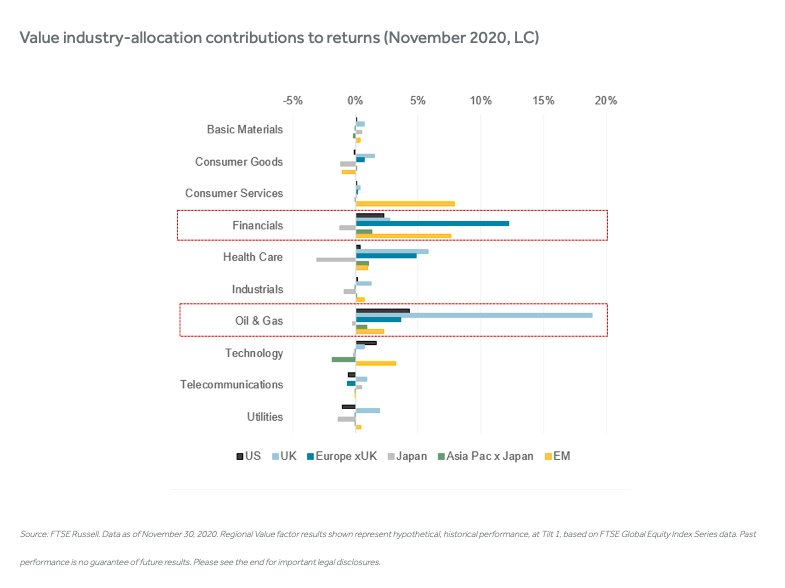
Source: FTSE Russell. Data as of November 30, 2020. Regional Value factor results shown represent hypothetical, historical performance, at Tilt 1, based on FTSE Global Equity Index Series data. Past performance is no guarantee of future results. Please see the end for important legal disclosures.
Our research also found that an industry-neutral Value strategy, or one focused on selecting the cheapest stocks within industries, broadly added value in November, with 38 of the 60 regional industry buckets posting positive excess returns.
Potential catalysts for a sustained Value revival
Further evidence that the vaccine rollout is quickening the global economic recovery may support Value in the short run. For a more durable rotation into Value, however, more pieces will need to fall into place.
Our research shows that Value tends to perform best when the outlook for the economy is good and/or improving and yields are rising. This suggests that a sustained rotation into Value would require a return to higher expected economic trend growth and a re-normalization of monetary policy. As shown below, there is a strong historical connection between rising US Treasury yields and Value outperformance. If a pick-up in growth expectations pushes US yields back up to around 2019’s 2% level, it would increase the odds of a structural shift in Value’s performance.
Regional relative Value/Quality factor returns (rebased, TR) vs FTSE US Govt 10-year bond yield
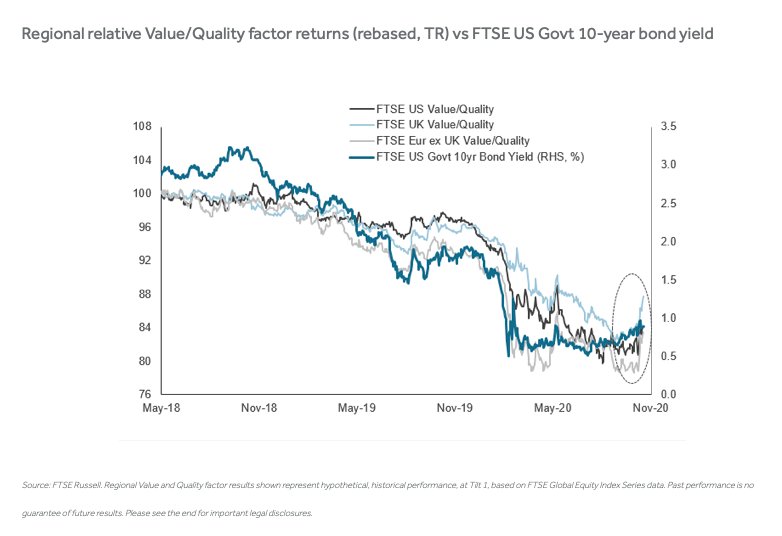
Source: FTSE Russell. Regional Value and Quality factor results shown represent hypothetical, historical performance, at Tilt 1, based on FTSE Global Equity Index Series data. Past performance is no guarantee of future results. Please see the end for important legal disclosures.
The fast vaccine progress is clearly changing the market narrative for 2021. But, for now, numerous unknowns remain around the implementation, efficacy and uptake of the vaccine, the near-term economic toll of the renewed global outbreak of coronavirus cases and how much of the recovery outlook for next year is already priced into today’s markets.
Photo Credit: Pictures of Money via Flickr Creative Commons
© 2020 London Stock Exchange Group plc and its applicable group undertakings (the “LSE Group”). The LSE Group includes (1) FTSE International Limited (“FTSE”), (2) Frank Russell Company (“Russell”), (3) FTSE Global Debt Capital Markets Inc. and FTSE Global Debt Capital Markets Limited (together, “FTSE Canada”), (4) MTSNext Limited (“MTSNext”), (5) Mergent, Inc. (“Mergent”), (6) FTSE Fixed Income LLC (“FTSE FI”), (7) The Yield Book Inc (“YB”) and (8) Beyond Ratings S.A.S. (“BR”). All rights reserved.
FTSE Russell® is a trading name of FTSE, Russell, FTSE Canada, MTSNext, Mergent, FTSE FI, YB and BR. “FTSE®”, “Russell®”, “FTSE Russell®”, “MTS®”, “FTSE4Good®”, “ICB®”, “Mergent®”, “The Yield Book®”, “Beyond Ratings®” and all other trademarks and service marks used herein (whether registered or unregistered) are trademarks and/or service marks owned or licensed by the applicable member of the LSE Group or their respective licensors and are owned, or used under licence, by FTSE, Russell, MTSNext, FTSE Canada, Mergent, FTSE FI, YB or BR. FTSE International Limited is authorised and regulated by the Financial Conduct Authority as a benchmark administrator.
All information is provided for information purposes only. All information and data contained in this publication is obtained by the LSE Group, from sources believed by it to be accurate and reliable. Because of the possibility of human and mechanical error as well as other factors, however, such information and data is provided “as is” without warranty of any kind. No member of the LSE Group nor their respective directors, officers, employees, partners or licensors make any claim, prediction, warranty or representation whatsoever, expressly or impliedly, either as to the accuracy, timeliness, completeness, merchantability of any information or of results to be obtained from the use of FTSE Russell products, including but not limited to indexes, data and analytics, or the fitness or suitability of the FTSE Russell products for any particular purpose to which they might be put. Any representation of historical data accessible through FTSE Russell products is provided for information purposes only and is not a reliable indicator of future performance.
No responsibility or liability can be accepted by any member of the LSE Group nor their respective directors, officers, employees, partners or licensors for (a) any loss or damage in whole or in part caused by, resulting from, or relating to any error (negligent or otherwise) or other circumstance involved in procuring, collecting, compiling, interpreting, analysing, editing, transcribing, transmitting, communicating or delivering any such information or data or from use of this document or links to this document or (b) any direct, indirect, special, consequential or incidental damages whatsoever, even if any member of the LSE Group is advised in advance of the possibility of such damages, resulting from the use of, or inability to use, such information.
No member of the LSE Group nor their respective directors, officers, employees, partners or licensors provide investment advice and nothing contained in this document or accessible through FTSE Russell Indexes, including statistical data and industry reports, should be taken as constituting financial or investment advice or a financial promotion.