By Tony Campos, director, SI product management, Americas
In the wake of the US presidential election, and as the composition of the US Senate remains in the balance, investors and analysts are struggling to understand what the US climate, energy and environmental policy landscape will look like over the next four years.
The President-elect has made clear that the US will rejoin the Paris Agreement on Climate Change, but unfortunately, we don’t have a crystal ball on other announcements. But we can look back over the recent past at the evolution of the US green economy to try to draw some conclusions about the sector’s prospects—despite uncertainties around the direction and detail of federal policy.

The green economy in the US has grown strongly over recent years, despite changes in domestic policy and regulation. It is outpacing more carbon-intensive sectors in terms of both size and performance. US markets have continued to advance on sustainability despite differences in the US approach to policy on climate, energy and the environment.
Green Economy
Understanding the green economy is important for institutional and retail investors, who are allocating capital in ever-growing volumes to ESG and sustainable investment funds. According to Morningstar, interest in US sustainable index funds is exploding: such funds have attracted $36.1 billion in net inflows over the past decade, of which 82% was invested in the 18 months to June 2020.1
These investors must understand how US companies are able to respond to the global transition to a low-carbon economy. Policy and regulation can assist investors when it comes to understanding and assessing the green economy. It is too soon to know how US policy will advance, and whether policies that support the transition will be driven by executive actions or whether legislation can be achieved with bipartisan support. A combination of legislative reform, agency, or executive action could provide considerable support for the green economy.
To anticipate the future of the green economy, we need to understand where it is today. To do so, we have developed the FTSE Russell Green Revenues Classification System (GRCS). It analyzes more than 16,000 companies globally to calculate the proportion of their revenues they earn from 10 green sectors, broken down in 133 micro-sectors. This classification system builds on earlier versions that we have used to track leading companies in the green economy for indexes since 2008.
$4 Trillion Market
Globally, we estimate that around 3,000 companies have some exposure to the green economy. The share of revenues they earn from green goods and services represents a market capitalization of around $4 trillion, or some 6% of the global economy. The global green economy is therefore materially larger than the global oil & gas supersector stocks in our ICB classification which represented about 3% of global equity market cap as of end of Sept (although it is worth noting that fluctuations in oil prices have since impacted that figure).
The sector is growing strongly: between 2009 and 2018 it grew at an annualized rate of 8%, far outstripping the rise in overall global GDP, which rose at an annualized 2.6%.
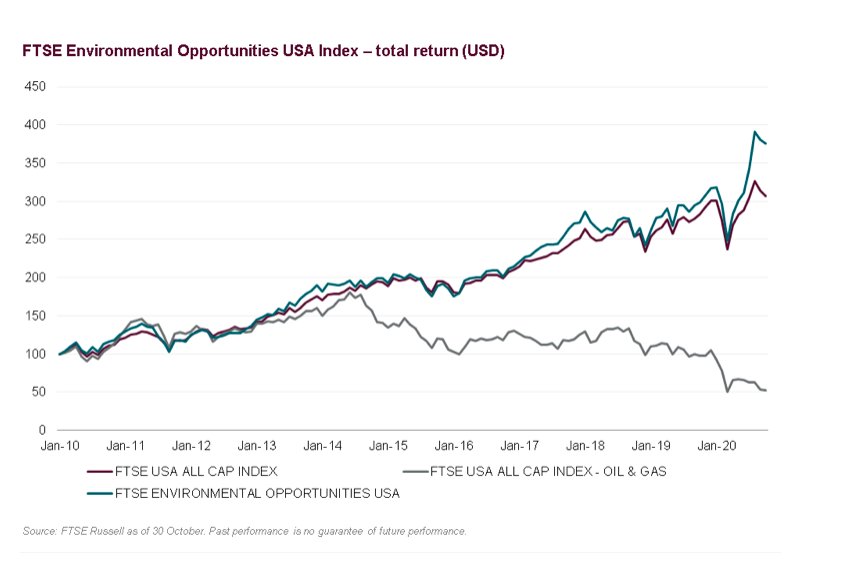
That story is also playing out in the US. FTSE’s Environmental Opportunities USA index, which tracks 125 US companies with significant exposure to the sector, has substantially pulled away from the benchmark FTSE USA All Cap. Its performance has been in stark contrast to that of the oil and gas sector, which has heavily underperformed in recent years, and especially in 2020.
US Leadership
As might be expected, given it has the world’s largest economy, the US accounts for the largest single proportion of the global green economy. But what might be more surprising is that the US share of the green economy stands at 37%, considerably greater than its share of global GDP, which stands at around 24%.
The clear picture that emerges from the data is that of a US green economy that is flourishing despite recent limited policy interventions in the US. The market has advanced in response to growing institutional investor and increasing consumer appetite for sustainable companies to invest in products and services. Add to this the increasing cost-competitiveness of clean technologies, as well as action and policy support at the US state level, and green economy opportunities that US companies are seizing in other parts of the world and the possibilities for growth are considerable
Certainly, the prospects for the growth of US green economy companies would be boosted if the US forges ahead with substantial legislative and regulatory progress in the space. While there are still some uncertainties surrounding how the US policy landscape will evolve, it is likely the sector will continue its record of strong growth.
Photo Credit: Eric Huybrechts via Flickr Creative Commons
Footnote: [1] Morningstar, Passive Sustainable Funds: The Global Landscape 2020
Disclosure
© 2020 London Stock Exchange Group plc and its applicable group undertakings (the “LSE Group”). The LSE Group includes (1) FTSE International Limited (“FTSE”), (2) Frank Russell Company (“Russell”), (3) FTSE Global Debt Capital Markets Inc. and FTSE Global Debt Capital Markets Limited (together, “FTSE Canada”), (4) MTSNext Limited (“MTSNext”), (5) Mergent, Inc. (“Mergent”), (6) FTSE Fixed Income LLC (“FTSE FI”), (7) The Yield Book Inc (“YB”) and (8) Beyond Ratings S.A.S. (“BR”). All rights reserved.
FTSE Russell® is a trading name of FTSE, Russell, FTSE Canada, MTSNext, Mergent, FTSE FI, YB and BR. “FTSE®”, “Russell®”, “FTSE Russell®”, “MTS®”, “FTSE4Good®”, “ICB®”, “Mergent®”, “The Yield Book®”, “Beyond Ratings®” and all other trademarks and service marks used herein (whether registered or unregistered) are trademarks and/or service marks owned or licensed by the applicable member of the LSE Group or their respective licensors and are owned, or used under licence, by FTSE, Russell, MTSNext, FTSE Canada, Mergent, FTSE FI, YB or BR. FTSE International Limited is authorised and regulated by the Financial Conduct Authority as a benchmark administrator.
All information is provided for information purposes only. All information and data contained in this publication is obtained by the LSE Group, from sources believed by it to be accurate and reliable. Because of the possibility of human and mechanical error as well as other factors, however, such information and data is provided “as is” without warranty of any kind. No member of the LSE Group nor their respective directors, officers, employees, partners or licensors make any claim, prediction, warranty or representation whatsoever, expressly or impliedly, either as to the accuracy, timeliness, completeness, merchantability of any information or of results to be obtained from the use of FTSE Russell products, including but not limited to indexes, data and analytics, or the fitness or suitability of the FTSE Russell products for any particular purpose to which they might be put. Any representation of historical data accessible through FTSE Russell products is provided for information purposes only and is not a reliable indicator of future performance.
No responsibility or liability can be accepted by any member of the LSE Group nor their respective directors, officers, employees, partners or licensors for (a) any loss or damage in whole or in part caused by, resulting from, or relating to any error (negligent or otherwise) or other circumstance involved in procuring, collecting, compiling, interpreting, analysing, editing, transcribing, transmitting, communicating or delivering any such information or data or from use of this document or links to this document or (b) any direct, indirect, special, consequential or incidental damages whatsoever, even if any member of the LSE Group is advised in advance of the possibility of such damages, resulting from the use of, or inability to use, such information.
No member of the LSE Group nor their respective directors, officers, employees, partners or licensors provide investment advice and nothing contained in this document or accessible through FTSE Russell Indexes, including statistical data and industry reports, should be taken as constituting financial or investment advice or a financial promotion.
Past performance is no guarantee of future results. Charts and graphs are provided for illustrative purposes only. Index returns shown may not represent the results of the actual trading of investable assets. Certain returns shown may reflect back-tested performance. All performance presented prior to the index inception date is back-tested performance. Back-tested performance is not actual performance, but is hypothetical. The back-test calculations are based on the same methodology that was in effect when the index was officially launched. However, back- tested data may reflect the application of the index methodology with the benefit of hindsight, and the historic calculations of an index may change from month to month based on revisions to the underlying economic data used in the calculation of the index.
This publication may contain forward-looking assessments. These are based upon a number of assumptions concerning future conditions that ultimately may prove to be inaccurate. Such forward-looking assessments are subject to risks and uncertainties and may be affected by various factors that may cause actual results to differ materially. No member of the LSE Group nor their licensors assume any duty to and do not undertake to update forward-looking assessments.
No part of this information may be reproduced, stored in a retrieval system or transmitted in any form or by any means, electronic, mechanical, photocopying, recording or otherwise, without prior written permission of the applicable member of the LSE Group. Use and distribution of the LSE Group data requires a licence from FTSE, Russell, FTSE Canada, MTSNext, Mergent, FTSE FI, YB and/or their respective licensors.