

After a tremendous first quarter, the U.S. equity market pulled back, experiencing a peak to trough decline of about 6% during the second quarter. Still, the U.S. market managed to close with modest gains for the quarter (up roughly 3%). Year-to-date, the S&P 500 Index (SPX) has risen a very positive 18%.
The international markets continued to show weakness given ongoing concerns about sovereign debt and general economic weakness through much of the developed and developing world.
The negative trend was most pronounced in the emerging market economies, which declined 8% during the quarter, while the developed country markets declined by 0.7%. Year-to-date, the MSCI Emerging Market Index has declined 9.4% while the developed country index, the MSCI EAFE, is up 4.5% for the year.
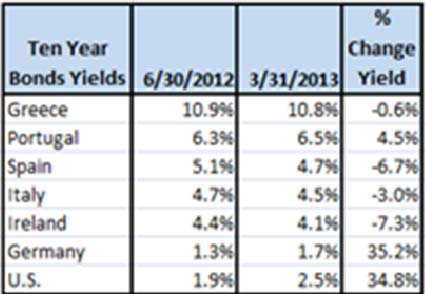
The 2nd quarter also brought volatility to the fixed income sector. Ten-year treasury yields ended the quarter at 2.52% (a rise from the 1.9% level of the prior quarter). The increase in yield produced a corresponding decline in the price of the 10-year bond with losses of 4.6% for the quarter and 4.9% year to date.
In general, financial markets turned volatile in May and June as investors grappled with concerns about when the U.S. central bank will begin tapering its $85 billion-per-month bond buying program and growing questions concerning the prospect of rising interest rates.
Other headwinds emerged on the geopolitical front as Middle East tensions continue to rise and slowing economic growth takes hold in the emerging markets – particularly China.
The Fed and QE
During the latter part of June, Fed Chairman Ben Bernanke provided markets with a clearer understanding on how the Fed expects to phase out its current quantitative easing program (QE).
Subject to continued U.S. economic recovery, Bernanke indicated that the Fed would begin to reduce its large scale QE purchases by year end and could end QE altogether by mid-2014.
The Fed’s strategy is based on the economic progress made so far and concerns about the future costs that a large Fed balance sheet could involve. It is also clear that the Fed does not intend to raise the federal funds rate ( 0-0.25% range), until the unemployment rate drops to at least 6.5%.
Although U.S. financial markets seemed spooked by the Fed’s time table, it is important to recognize that the current QE program, combined with a near-zero federal funds rate, amounts to one of the most extreme dose of monetary stimulus applied by the Federal Reserve in its 100-year history.
With the economy in its fifth year of recovery, unemployment improving, and home prices and stock prices up sharply, it is entirely appropriate that the Fed adjust to these changed conditions. It has never been a question of whether the Fed would adjust its policies, it has only been a question of when and how they would do so.
It is hoped that Bernanke and Fed can successfully navigate through what continues to be unprecedented and uncharted territory.
U.S. Economy
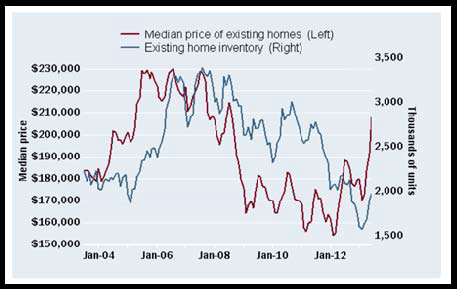
Although GDP growth remains subpar, the U.S. recovery continues – with housing being a particular bright spot. Housing starts rose 6.8% in May while building permits outpaced housing starts, reaching a five-year high. Median prices for existing homes rose 15.4% over the prior 12 months. This helps bolster both consumer net worth and confidence.
The job market also made solid improvement during the 2nd quarter. The economy added 195,000 new jobs in June and has averaged 202,000 new jobs monthly in 2013. The biggest job gains have been in leisure and hospitality while federal employment continues to decline.
Since the beginning of the recovery, U.S. employment has regained approximately 6.9 million jobs. And today’s unemployment rate now stands at 7.6%.
Consumer inflation climbed to 1.4 % in the 12 months through June 30. This remains below the Fed’s target rate of 2.0%. Low growth rates in both the developing and emerging markets, combined with restrained wage gains in the U.S are key influences in the U.S. inflation rate.
The Fed watches inflation closely to protect against the risk of inflation but also to guard against the risk of the U.S. falling into a Japan-like deflationary spiral. While inflation is a widely understood risk, the economic impact of a deflationary cycle can also be severe and very hard to reverse.
The U.S. economy, as measured by GDP, grew at a 1.8% annual rate in the 1st quarter of 2013. This is above the prior quarter’s growth (0.4%) but below the twenty-year average of 2.5%.
Three of the four most cyclical areas of the economy (vehicle sales, private inventories and real capital goods orders) are now at levels above their 20-year averages – reflecting the economic progress being made. Some would argue that the economy is no longer in recovery but in an expansion phase (albeit expansion at a slow pace).
World Economy
From a global perspective, manufacturing continues to be mixed. While manufacturing in the Euro region is still below its average levels, virtually every country except Germany reported improvement. In China, manufacturing has declined, perhaps signaling economic contraction.
In contrast, Japan’s manufacturing continues to strengthen, with a manufacturing index reading above that of the U.S. Other emerging markets such as India, Brazil, Russia are in expansion territory.
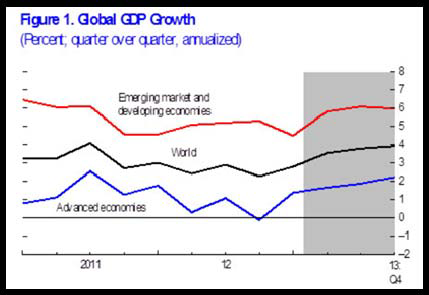
Going forward, global growth in 2013 is projected to remain subdued in the 3% to 4% range (the same rate experienced in 2012 but less than that forecast in April 2013 by the International Monetary Fund).
To a large extent, subdued global growth has been driven by weaker global demand, slowing growth in key emerging economies and a more protracted recession in the Euro area. Downside risks to global growth are still prevalent.
There remains the possibility of a longer slowdown in emerging market economies. The pace and timing of recovery in the Eurozone is uncertain. It is also unclear how the anticipated unwinding of Fed policy stimulus will play out in the U.S. and global economies.
Investments – U.S. Equities
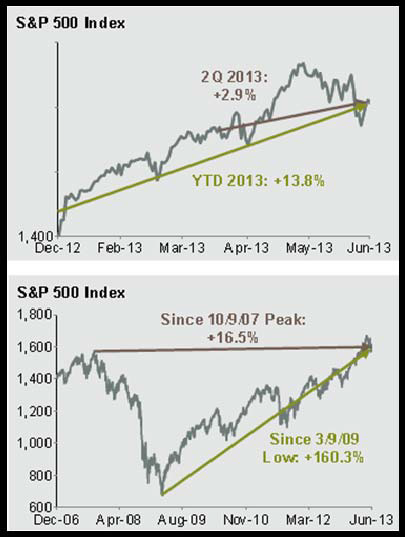
Although the U.S. financial markets experienced volatility during the 2nd quarter, they still managed to post positive returns. The S&P 500 rose 2.9% for the quarter and has risen about 18% year to date. Despite the 2nd quarter’s pullback, returns for the first six months of the year were the best since 1998.
Except for energy, utilities and materials, the U.S. equity sectors all showed gains for the quarter. The best performing sectors included: financials, healthcare and consumer discretionary — each of which gained close to 20% in the first half of the year.
The S&P 500 has now risen 160.3% from its March 2009 lows, and is 16.5% above its October 2007 peak. Small U.S. stocks have done even better and are now 25.4% above their prior high. Since hitting the market bottom in March 2009, value stocks have outperformed growth stocks throughout the size spectrum.
From a stock valuation perspective, using forward P/E (current stock price divided by estimated future earnings over the next twelve months), the S&P 500 is now priced at 13.9 times forecasted earnings. This is a small increase over the prior quarter but lower than the 15-year average of 16.4. Corporate earnings continue to gain strength and are at a historical high of $25.77. The current dividend yield for the S&P 500 stands at 2.0%
Investments – International Equities
Given a strengthening dollar, international markets posted mixed results. Most developed economies gained modestly in local currency but declined in dollar terms.
The MSCI EAFE index, the most widely used international index, gained 1.4% in local currency while U.S. investors saw returns drop by 0.7%. Japan posted gains of 10.2% for local investors but only 4.3% in dollar terms. Germany and France both returned over 3.4% to U.S. investors during the quarter. The MSCI EAFE index has risen 19.1% over the last 12 months.
Over the last 10 years, the index has risen by 8.2% annually (compared to the S&P’s rise of 7.3% per year). During the quarter, the MSCI Emerging Markets Index declined 4.3% for local investors and by nearly 8.0% for U.S. investors. The emerging economies continue to experience slowing growth.
All of the BRIC countries (Brazil, Russia, India and China) experienced declines during the quarter and on a year-to-date basis declines have ranged from -.8% in India to –17.8% in Brazil. Nonetheless, over the last 10 years, the Emerging Markets asset class has been the best performing equity sector with a compound annual return of 14%.
Investments – Fixed Income
During the 2nd quarter, prices in all major bond sectors declined. The Fed’s announcement of anticipated changes in its QE policy sent Treasury yields sharply higher. The 10-year Treasury yield increased by a third to an annual yield of 2.52% (from a low of 1.5% last June).
This increase in yield produced a 4.6% decline in the price of existing 10-year treasuries. It is worth noting that with the core CPI inflation rate now at 1.7%, the “real,” (after inflation) yield of the 10-year Treasury stands at 0.82% (far below the roughly 2.5% historical average real yield of the last 50 years). This suggests that “real” interest rates will still need to rise by nearly 2% before they achieve their historical “normal level.”
The overall U.S. bond market (BarCap Aggregate Bond Index) declined 2.3% for the quarter and has declined 0.7% over the last 12 months. Over the quarter, short term bonds experienced a modest decline of 0.12% while intermediate and long term bonds lost 1.7% and 6.1%, respectively.
Given a low inflationary environment, U.S. Treasury Inflation Protection Securities (TIPS) underperformed nominal treasuries declining 7.1 % in the quarter. Over the last 12 months, TIPs have declined 4.8% while long term bonds are down 4.7%. Over the last year, short and intermediate bonds have seen modest gains of 0.74 % and 0.28% respectively.
Given the higher initial yields paid by lower rated bond issues, price declines in both emerging markets debt and high yield bonds were more modest than might otherwise be anticipated. For the quarter, dollar denominated emerging markets bonds declined by 2.4% while U.S. high yield bonds fell by 1.4%. Both categories had positive returns over the last 12 months (1.8% for emerging bonds and 9.5% for high yield).
Although bonds saw price declines over the recent period, it is important to remember the strategic role of fixed income in a portfolio: portfolio stability, capital preservation, income generation and a low-to-negative correlation with equity investments – essential goals for the long term investor.
Investments – Alternatives
Our alternative holdings posted mixed returns this quarter. The returns for 2nd quarter alternative holdings are as follows:
The Alerian Master Limited Partnerships Infrastructure Index (energy transportation and storage) gained 3.6% in the 2nd quarter and is up 31.0% for the prior 12 months.
Global real estate, represented by the FTSE EPRA/ NAREIT Global REIT Index, lost 4.3% during the quarter but is up 14.2% over the prior 12 months. Timber, as measured by the FTSE NAREIT Timber REIT, also declined 8.6% for the quarter but gained 14.2% over the prior 12 months.
Commodities (broadly: energy, precious metals, agriculture and livestock) continued to experience declines during the quarter. The Dow Jones UBS Commodity Index declined 9.5% for the period and is down 8.0% over the preceding 12 months.
Summary
Risks and opportunities continue to be present as we look ahead. Financial markets have seen significant gains over the last few years. This has been driven by an extremely accommodative Fed policy that has fueled recovery in the housing market, employment, and corporate balance sheets.
It is important to remember that one of the characteristics of a more mature bull market, such as the one we are in today, is that asset prices become more susceptible to contractions due to negative news or negative perceptions (like reaction to the Fed’s announcement on reducing quantitative easing).
Although market results can never be assured, we believe that maintaining a disciplined investment approach that includes a globally diversified portfolio of equity, bonds and alternative strategies will position you well for the future.
At Mosaic, it is our hope and expectation that we can continue to help you progress toward your long term financial goals. We manage the Strategic Asset Allocation portfolio at Covestor.
All opinions included in this material are as of July 31, 2013 and are subject to change. The opinions and views expressed herein are of the portfolio manager and may differ from other managers, or the firm as a whole. Any index comparisons provided in the blogs are for informational purposes only and should not be used as the basis for making an investment decision. There are significant differences between client accounts and the indices referenced including, but not limited to, risk profile, liquidity, volatility and asset composition. Past performance does not guarantee future results.

