By: Jose Torres, Senior Economist, Interactive Brokers
Crude prices are rising on renewed geopolitical tensions triggered by President Trump threatening Oman with military strikes and communicating that he is in no rush to end the Iran war. Moreover, a fresh burst of violence in Lebanon is worrying market participants about the potential for an intense escalation of Middle East hostilities. The adverse developments are hurting Treasuries and cyclical stocks, as heavier oil costs are lifting inflation expectations while hampering corporate margin prospects. The curve is climbing in bear-steeping fashion led by duration because a variety of weak economic data released recently, including this morning’s sluggish homebuilder sentiment print, is containing the short-end while limiting the Fed’s ability to hike. Tech equities are bucking the trend as illustrated by the Nasdaq 100 being the sole major domestic benchmark to advance on the session. It received a strong assist from Anthropic, which reported a revenue surge that added new evidence of AI’s capacity to propel earnings for years to come. Just 2 of the 11 principal sectors are in the green; however, cryptocurrencies and commodities are jumping broadly. Elsewhere, the greenback is slightly weaker, volatility protection instruments are catching bids on stronger hedging demand and prediction markets are experiencing engagement as well.
Homebuilders’ Downbeat Sentiment Continues
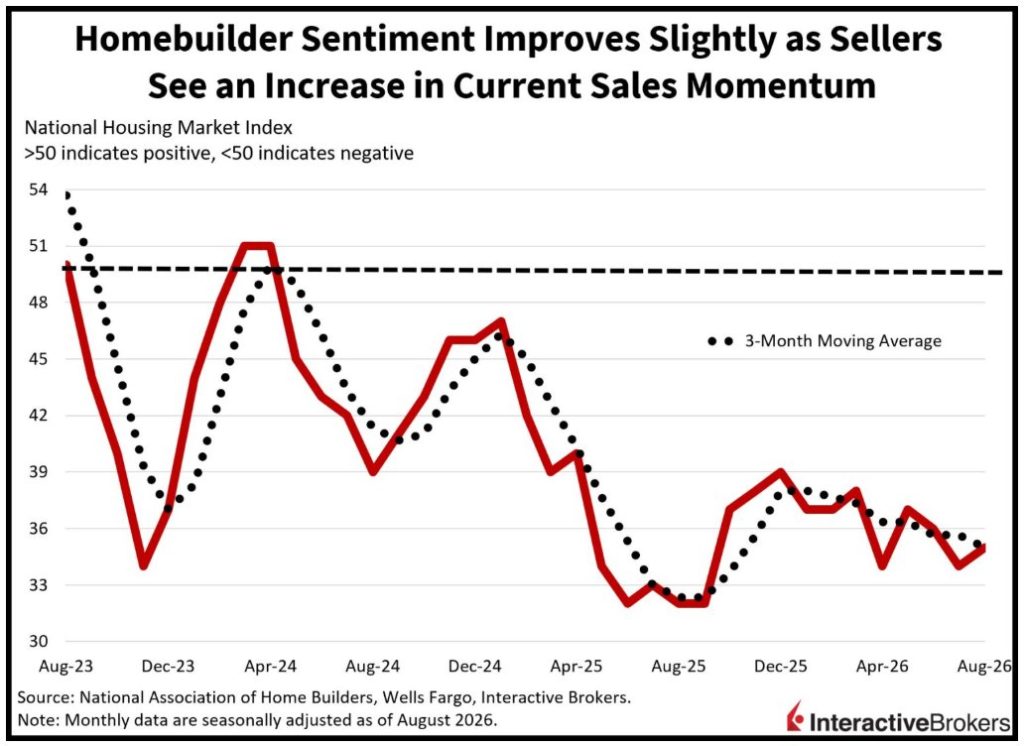
Homebuilder sentiment improved slightly this month but remained depressed by historical standards, a result of elevated mortgages charges, high prices for materials and lofty valuations dampening the outlook for transactions. The headline number of 35 rose modestly from July’s 34 and surpassed the median estimate of 33; however, it arrived well below the negative-positive threshold of 50. Meanwhile, the overall one-point gain was driven by the current-sales component increasing from 37 to 39. That advance was met with unchanged figures of 43 and 23 for the 6-month projection for closings and the traffic of prospective buyers in the present indices. From a regional perspective, the Northeast, South and West climbed from 41, 31, 26, to 42, 32 and 27 while the Midwest was flat at 45.
Retail Earnings Could Confirm or Refute Slowdown
Retail earnings data to be released this week paired with minutes from the Federal Reserve’s July meeting will offer significant clues about the health of the consumer as well as where the committee as a whole stands regarding monetary policy. Indeed, recent economic data on employment growth, spending and sentiment have been awful, and quarterlies from large-cap vendors are poised to provide another set of evidence that either confirms or refutes shopper slowdown anxieties. The results are scheduled to arrive just as fixed-income watchers have pared back Fed hike expectations due to a belief that contracting payrolls are a meaningful risk that the central bank must pay attention to despite Chair Kevin Warsh’s unwavering focus on inflation. Additionally, slowing price pressures also grant voting members additional flexibility when considering future interest rate decisions, especially against the backdrop of waning hiring appetites, depleted savings and declining confidence that together can weigh on the ability for households to keep powering the cycle forward.
International Roundup
Canada’s Inflation Strengthens and Exceeds Expectations
Expensive gasoline contributed to Canada’s July inflation strengthening and exceeding expectations with the Consumer Price Index climbing 3% year over year (y/y) and 0.5% month over month (m/m), according to Statistics Canada. Economists expected y/y and m/m results of 2.9% and 0.4% following June’s 2.8% y/y climb and 0.4% monthly decline. The annual number was pushed higher by gasoline, travel tours and air transportation climbing 25.7%, 15.2% and 12%. For the m/m print, the transportation category became 1.4% more costly, a result of gasoline jumping 3.6%. Household operations, furnishings and equipment, furthermore, were 1.1% more costly. When excluding food and energy, the gauge was up 1.9% y/y and 0.4% m/m. The core gauge, while increasing, is still lower than the Bank of Canada’s goal of keeping inflation below 2%.
China Publishes Discouraging Data
China’s retail sales, industrial production, labor market and housing prices in July all pointed to ongoing challenges with the world’s second-largest economy. Consider the following discouraging prints:
- House prices fell 3.2% y/y following the 3.3% June drop. Home prices have fallen every month since May 2022 with the exception of May and June of 2023. The contraction is a result of China building too many residences and consumers’ weak finances and persists despite the country easing restrictions on foreigners buying real estate.
- Industrial production growth decelerated from 5.3% y/y to 4.5% and missed the economist consensus forecast of 5%. Steel was a major headwind with slowing construction causing output to dip 3.6% y/y. Crude oil refining and coal production, with declines of 16% and 10% also dampened output. Crude refining was impacted by the US-Iran war while safety inspections weighed on mining activity.
- Fixed investment, after sinking 5.7% y/y in June, slipped 6.7% in July, a worse result than the economist consensus estimate for a 6.2% contraction.
- Retail sales slowed from a 1% y/y growth rate in June to only 0.6% last month. Economists expected sales would accelerate to 1.5%.
- The unemployment rate went from 5% to 5.2%, surpassing the estimate for a 5.1% print.
Japan GDP Trails Expectations
Japan’s gross domestic product grew 0.3% quarter over quarter (q/q) and 1.1% y/y during the April through June period, according to a flash estimate from the Cabinet Office. The pace slowed from the 0.5% and 1.9% expansion during the first three months of the year and missed the 0.5% and 2% q/q and y/y economist consensus estimates. Private consumption was flat q/q, considerably weaker than the expectation for a repeat of the first quarter’s 0.5% advance. External demand, however, climbed 0.5%, surpassing the 0.3% estimate and the first quarter’s 0.3% result.
Originally posted on August 17, 2026 on Traders’ Insight blog
PHOTO CREDIT: https://www.shutterstock.com/g/mihacreative
VIA SHUTTERSTOCK
DISCLOSURES:
Disclosure: Interactive Brokers Affiliate
Information posted on IBKR Campus that is provided by third-parties does NOT constitute a recommendation that you should contract for the services of that third party. Third-party participants who contribute to IBKR Campus are independent of Interactive Brokers and Interactive Brokers does not make any representations or warranties concerning the services offered, their past or future performance, or the accuracy of the information provided by the third party. Past performance is no guarantee of future results.
This material is from IBKR Macroeconomics, an affiliate of Interactive Brokers LLC, and is being posted with its permission. The views expressed in this material are solely those of the author and/or IBKR Macroeconomics and Interactive Brokers is not endorsing or recommending any investment or trading discussed in the material. This material is not and should not be construed as an offer to buy or sell any security. It should not be construed as research or investment advice or a recommendation to buy, sell or hold any security or commodity. This material does not and is not intended to take into account the particular financial conditions, investment objectives or requirements of individual customers. Before acting on this material, you should consider whether it is suitable for your particular circumstances and, as necessary, seek professional advice.