

By: Michael Kramer
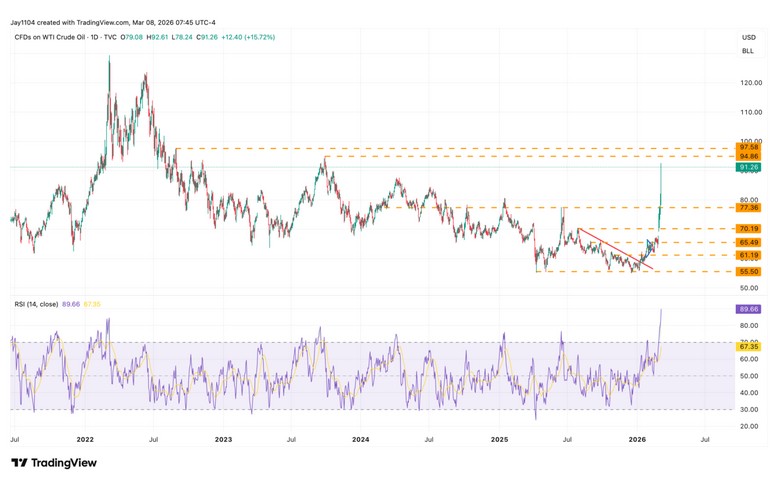
The S&P 500 dropped more than 1% on Friday as oil prices surged and the job report came in well below estimates. Oil climbed over $91 on Friday, and IG Weekend Oil is trading up almost 6%, indicating an opening around $951. Meanwhile, the weekend Nasdaq 100 proxy is trading2 lower by about 70 basis points3. It is common to see futures on Sunday night open near the indicated weekend levels, which helps in understanding where and why future prices are moving higher or lower.
An open around $95 for oil would place it at its next level of resistance and its highest price since September 2023. After $95, things in oil get more interesting because resistance levels thin out, and we could easily see oil surge into the $100 to $110 range. Even though oil is technically overextended, with an RSI over 70 and trading well above its upper Bollinger Band, technicals currently take a back seat as the commodity reprices in our new world environment.
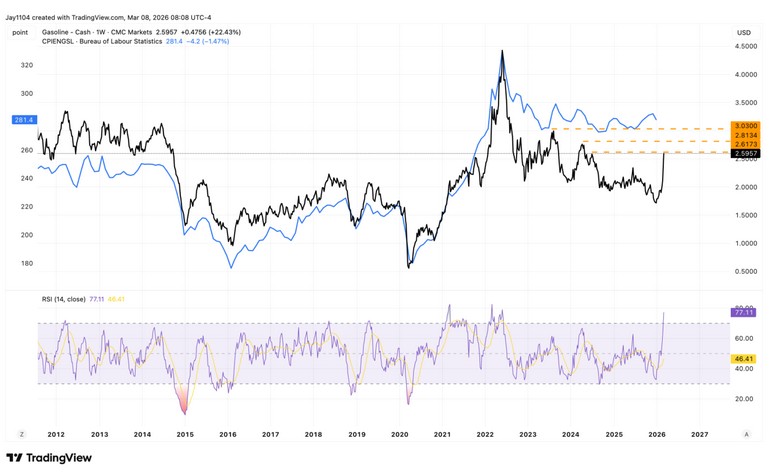
Of course, gasoline prices are also rising, and that becomes more significant given the current resistance at $2.60, followed by $2.81 and then $3.00. Rising gasoline and oil prices will not help the inflation outlook, and this week, inflation will be in focus, with both the February CPI and January PCE reports being released. For the most part, the CPI energy index simply follows the price of gasoline, so one can expect that while February energy data may not be affected much of the rise in oil and gasoline, March likely will. Gasoline alone has nearly a 3% weighting in the headline CPI report.
Rising commodity prices are likely to put upward pressure on interest rates until the price is deemed too high and damaging to the economy. Once that happens, rates will no longer rise and will begin to fall. That, in my view, will be the market’s recession warning.

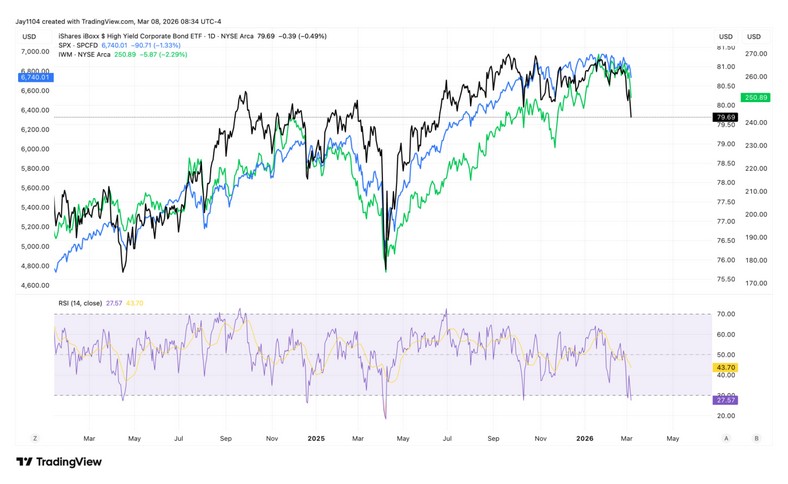
Interestingly, when you invert the HYG ETF and overlay it with RBOB gasoline, it shows a clear relationship between the two as well. Rising gasoline and oil prices will, in essence, not only drag the HYG ETF lower but will also likely lead to considerably wider credit spreads.

In the end, high-yield credit trades like equity, so if high-yield credit continues to feel pressured due to rising oil and gasoline prices, it will be hard for stocks to hold their current levels, whether it’s the S&P 500 or the Russell 2000.
We will just have to wait to see where this ultimately goes and where oil and gasoline settle out; right now, it is just not entirely clear.
Originally posted on March 8, 2027 on Mott Capital blog
PHOTO CREDIT: https://www.shutterstock.com/g/EgorovArtem
VIA SHUTTERSTOCK
FOOTNOTES AND SOURCES
1 https://www.ig.com/en/indices/markets-indices/weekend-oil—us-crude
2 https://www.ig.com/en/indices/markets-indices/weekend-us-tech-100-e1
3 https://www.ig.com/en/indices/markets-indices/weekend-us-tech-100-e1
Glossary by ChatGPT
Bollinger Band — A technical analysis indicator consisting of a moving average and two volatility bands used to identify overbought or oversold conditions.
CPI (Consumer Price Index) — A key inflation measure tracking the average change over time in prices paid by consumers for goods and services.
Credit Spreads — The difference in yield between corporate bonds and comparable government bonds, reflecting perceived credit risk.
HYG ETF — The iShares iBoxx $ High Yield Corporate Bond ETF, commonly used to track the performance of U.S. high-yield (junk) corporate bonds.
Nasdaq 100 — A stock market index composed of 100 of the largest non-financial companies listed on the Nasdaq exchange.
PCE (Personal Consumption Expenditures Price Index) — The Federal Reserve’s preferred inflation gauge measuring price changes for consumer goods and services.
RBOB Gasoline — Reformulated gasoline blendstock for oxygenate blending, a benchmark futures contract used to track wholesale gasoline prices.
Resistance — A price level where an asset historically struggles to move higher due to increased selling pressure.
RSI (Relative Strength Index) — A momentum indicator that measures the speed and magnitude of price movements to identify overbought or oversold conditions.
Russell 2000 — A stock market index tracking 2,000 small-cap U.S. companies and commonly used as a gauge of small-cap equity performance.
S&P 500 — A benchmark U.S. equity index tracking the performance of 500 large publicly traded companies.
DISCLOSURES
This report contains independent commentary to be used for informational and educational purposes only. Michael Kramer is a member and investment adviser representative with Mott Capital Management. Mr. Kramer is not affiliated with this company and does not serve on the board of any related company that issued this stock. All opinions and analyses presented by Michael Kramer in this analysis or market report are solely Michael Kramer’s views. Readers should not treat any opinion, viewpoint, or prediction expressed by Michael Kramer as a specific solicitation or recommendation to buy or sell a particular security or follow a particular strategy. Michael Kramer’s analyses are based upon information and independent research that he considers reliable, but neither Michael Kramer nor Mott Capital Management guarantees its completeness or accuracy, and it should not be relied upon as such. Michael Kramer is not under any obligation to update or correct any information presented in his analyses. Mr. Kramer’s statements, guidance, and opinions are subject to change without notice. Past performance is not indicative of future results. Neither Michael Kramer nor Mott Capital Management guarantees any specific outcome or profit. You should be aware of the real risk of loss in following any strategy or investment commentary presented in this analysis. Strategies or investments discussed may fluctuate in price or value. Investments or strategies mentioned in this analysis may not be suitable for you. This material does not consider your particular investment objectives, financial situation, or needs and is not intended as a recommendation appropriate for you. You must make an independent decision regarding investments or strategies in this analysis. Upon request, the advisor will provide a list of all recommendations made during the past twelve months. Before acting on information in this analysis, you should consider whether it is suitable for your circumstances and strongly consider seeking advice from your own financial or investment adviser to determine the suitability of any investment.


