

By: Gerry Sparrow
Stocks logged a third-straight down week as investors digested the latest news out of the Middle East, navigated more volatility, and mulled the latest economic data.
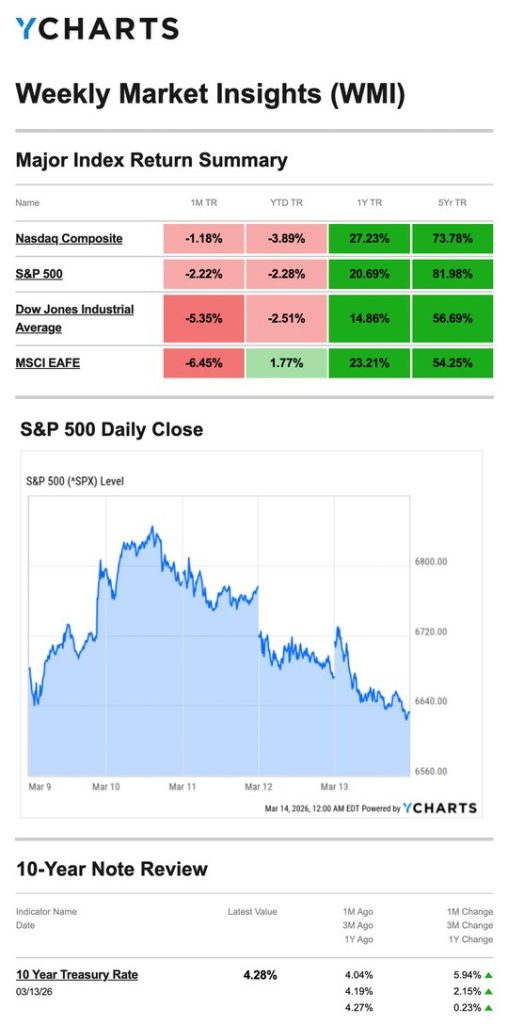
The Standard & Poor’s 500 Index declined 1.60 percent, while the Nasdaq Composite Index lost 1.26 percent. The Dow Jones Industrial Average fell 1.99 percent. The MSCI EAFE Index, which tracks developed overseas stock markets, slid 2.28 percent.1,2
Middle East
Markets got a volatile start to the week, with stocks falling and oil prices rising as commercial maritime traffic heading out of the Persian Gulf through the Strait of Hormuz remained at a virtual standstill. But stocks rebounded late in the day after the White House said the conflict may end sooner than expected.3
Stocks dropped at Tuesday’s opening bell, but mostly recovered after word spread that a group of countries, including the U.S., were considering a coordinated release of strategic oil reserves to counter supply disruptions. Markets generally went sideways midweek as news that the Consumer Price Index (CPI) held steady last month buoyed spirits.4,5
As the week progressed, all three major averages fell, and oil prices hit all-time closing highs. Investors grew increasingly concerned over the impact of oil supply disruptions on the broader global economy, with the Strait of Hormuz remaining a concern. Bond yields rose as investors believed a prolonged conflict would keep oil prices high, increasing the chance of higher inflation.6
Market sentiment continued to struggle as the week wrapped up, but declines slowed despite a downward revision to Q4 gross domestic product (GDP) growth.7
Source: YCharts.com, March 14, 2026. Weekly performance is measured from Monday, March 9 to Friday, March 13. TR = total return for the index, which includes any dividends as well as any other cash distributions during the period. Treasury note yield is expressed in basis points.
Stubborn Inflation
With all the updates on the Middle East conflict, it was easy to miss other news last week.
Wednesday’s report that the CPI remained unchanged in February over the prior 12 months was good news. But it was the last bit of inflation data before the conflict in the Middle East began. Friday’s Personal Consumption & Expenditures Index, the Fed’s preferred inflation measure, showed that consumer prices remained sticky in January. Investors largely took this report in stride because delayed reports tend to lose their impact with time.8,9
This Week: Key Economic Data
Monday: Industrial Production. Capacity Utilization.
Tuesday: Federal Open Market Committee (FOMC) Meeting—Day 1. Pending Home Sales. Homebuilder Confidence.
Wednesday: FOMC Meeting—Day 2. Producer Price Index (PPI). Factory Orders* (Jan.). FOMC Interest Rate Decision. Fed Chair Press Conference.
Thursday: Weekly Jobless Claims. Wholesale Inventories* (Jan.) New Home Sales* (Jan.).
Friday: Employment Cost Index (Q4).
*Indicates federal data release delayed by the government shutdown
Source: Investors Business Daily – Econoday economic calendar: March 13, 2026. The Econoday economic calendar lists upcoming U.S. economic data releases (including key economic indicators), Federal Reserve policy meetings, and speaking engagements of Federal Reserve officials. The content is developed from sources believed to provide accurate information. The forecasts or forward-looking statements are based on assumptions and may not materialize. The forecasts are also subject to revision.
Originally posted on March 17, 2026
PHOTO CREDIT: https://www.shutterstock.com/g/Poring2017
VIA SHUTTERSTOCK
FOOTNOTES AND SOURCES
1. WSJ.com, March 13, 2026
2. Investing.com, March 13, 2026
3. CNBC.com, March 9, 2026
4. CNBC.com, March 10, 2026
5. CNBC.com, March 11, 2026
6. WSJ.com, March 12, 2026
7. WSJ.com, March 13, 2026
8. CNBC.com, March 11, 2026
9. WSJ.com, March 13, 2026
DISCLOSURES
Investing involves risks, and investment decisions should be based on your own goals, time horizon, and tolerance for risk. The return and principal value of investments will fluctuate as market conditions change. When sold, investments may be worth more or less than their original cost.
The forecasts or forward-looking statements are based on assumptions, may not materialize, and are subject to revision without notice.
The market indexes discussed are unmanaged, and generally, considered representative of their respective markets. Index performance is not indicative of the past performance of a particular investment. Indexes do not incur management fees, costs, and expenses. Individuals cannot directly invest in unmanaged indexes. Past performance does not guarantee future results.
The Dow Jones Industrial Average is an unmanaged index that is generally considered representative of large-capitalization companies on the U.S. stock market. The Nasdaq Composite is an index of the common stocks and similar securities listed on the Nasdaq stock market and considered a broad indicator of the performance of stocks of technology and growth companies. The MSCI EAFE Index was created by Morgan Stanley Capital International (MSCI) and serves as a benchmark of the performance of major international equity markets, as represented by 21 major MSCI indexes from Europe, Australia, and Southeast Asia. The S&P 500 Composite Index is an unmanaged group of securities that are considered to be representative of the stock market in general.
U.S. Treasury Notes are guaranteed by the federal government as to the timely payment of principal and interest. However, if you sell a Treasury Note prior to maturity, it may be worth more or less than the original price paid. Fixed income investments are subject to various risks including changes in interest rates, credit quality, inflation risk, market valuations, prepayments, corporate events, tax ramifications and other factors.
International investments carry additional risks, which include differences in financial reporting standards, currency exchange rates, political risks unique to a specific country, foreign taxes and regulations, and the potential for illiquid markets. These factors may result in greater share price volatility.
Please consult your financial professional for additional information.
This content is developed from sources believed to be providing accurate information. The information in this material is not intended as tax or legal advice. Please consult legal or tax professionals for specific information regarding your individual situation. This material was developed and produced by FMG Suite to provide information on a topic that may be of interest. FMG is not affiliated with the named representative, financial professional, Registered Investment Advisor, Broker-Dealer, nor state- or SEC-registered investment advisory firm. The opinions expressed and material provided are for general information, and they should not be considered a solicitation for the purchase or sale of any security.
Copyright 2026 FMG Suite.
Important Risk Information
The fund’s investment objectives, risks, charges and expenses must be considered carefully before investing. The prospectus contains this and other important information about the investment company, and it may be obtained by calling 888-727-3301 or visiting www.sparrowcapital.com. Read it carefully before investing.
Investing involves risk of principal loss. Overall stock market risks may affect the value of the Fund. Factors such as domestic economic growth and Market conditions, interest rate levels, and political events affect the securities markets and could case the Fund’s share price.
Stocks of mid-cap companies are riskier than stocks of larger companies. Many of these companies are young and have a limited track record. Their securities may trade less frequently and in more limited volume than those of more mature companies.
Small Cap Risk. To the extent the Fund invests in small-cap companies, the Fund will be subject to additional risks. They include that the earnings and prospects of smaller companies are move volatile than larger companies. Smaller companies may experience higher failure rates than do larger companies.
When the Fund invests in ETF’s and other investment companies, it will indirectly bear its proportionate share of any fees and expenses payable directly by the underlying ETF’s or other investment company. Therefore, the Fund will incur higher expenses. In addition, ETF’s are also subject to the following risks (i) the market price of an ETF’s shares may trade above or below its net asset value; (ii) an active trading market for an ETF’s shares may not develop or be maintained; (iii) trading of an ETF’s shares may be halted if the listing exchange’s officials deem such action appropriate, the shares ate de-listed from the exchange, or the activation of market-wide “circuit breakers” (which are tied to large decreases in stock prices) halts stock trading generally; or (iv) the ETF’s may fail to achieve close correlation with the index that it tracks due to a variety of factors, such as rounding of prices and changes to the index and/or regulatory policies, resulting in the deviating of the ETF’ s returns from that of the index.
Distributor: Foreside Fund Services LLC


