By Jay Jacobs, CFA and analyst, Global X
Nobody wants to overpay for an investment, but in many cases “cheap” stocks are cheap for a reason and “expensive” stocks are expensive for a reason. Securities with low valuations may have minimal growth prospects or structural concerns, while those trading at elevated multiples may be pioneering revolutionary technologies, products, or services.
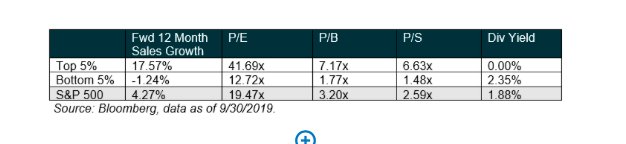
Take for example the top 5% of companies in the S&P 500 by expected sales growth over the next 12 months. While these high growth firms are expected to accelerate their top line revenues more than four times faster than the median level for the S&P 500, they also come with elevated valuations.
Price-to-earnings, price-to-sales, and price-to-book metrics are all more than double those of the median S&P 500 firm.
FAANG Play
Of the top 5% fastest revenue growers, 60% hail from the more innovative Information Technology and Communication Services sectors, including familiar FAANG names like Facebook, Amazon, Netflix, and Google (Alphabet).(1)
By contrast, in the group of the bottom 5% – those with the slowest expected 12 month revenue growth – only 8% come from IT or Communications Services, with many categorized as Industrials, Energy, and Utilities. And while their valuations are noticeably lower than the S&P 500 median, so too is their growth rate, coming in at a negative value, implying shrinking businesses.
When looking at the firms at the forefront of disruptive themes, they, like the top 5% bucket, often possess both high growth expectations and high valuations. This can spur questions from investors about whether the valuations are appropriate for their expected growth, or if they are too high to justify an investment. Below we offer a few approaches and considerations to evaluate the multiples of disruptive themes.
Don’t Harp on Earnings-based Multiples
Some themes can show unusually high, or even negative price-to-earnings (P/E) ratios, particularly themes early in their adoption cycles. High growth companies simply are not trying to generate earnings – at least not during periods of rapid expansion. While this may sound counter-intuitive, imagine a firm that develops cutting edge artificial intelligence algorithms and expects to generate $10 million in free cash flow.
The firm could prioritize booking that $10 million as earnings and return the money to shareholders as a dividend or stock buyback, or retain the earnings for future use. Alternatively, it could prioritize growth and spend the $10 million by hiring teams of engineers or sales people. In the fast-moving world of disruptive companies, most would choose to invest the $10 million back into R&D or sales to further develop their product or grow their market share as they race to beat their competition. They are prioritizing growth over profitability, usually with the blessing of their investors who demand rapid growth.
IPOs
Recent IPOs (and failed IPOs) of popular startups have brought renewed attention to profitability in the high growth space. A common explanation for these failures is that the firm’s lack of profitability challenges the sustainability of their business model.
In light of these developments, we believe it is important for investors to accurately distinguish between disruptive firms that are choosing not to be profitable because they are investing in a defensible business versus firms that are unable to be profitable due to a flawed business model.
One example of this is in the genomics space, where high R&D costs mean many leading firms in the space often lose money until they develop and receive approval of a successful drug. Just because they are not profitable currently, does not mean their business model is unable to capture positive earnings in the future.
Looking to Sales-based Metrics
Rather than analyzing earnings-based valuations, a preferred technique is to consider sales-based metrics, such as the price-to-sales (P/S) ratio.
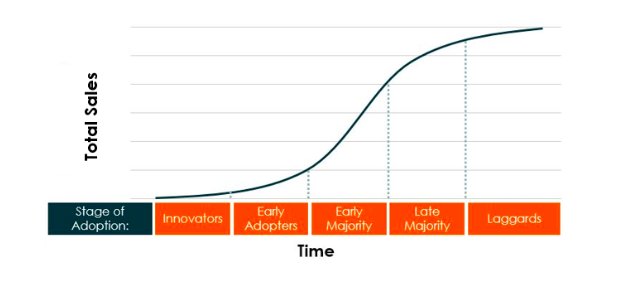
While high growth firms may care little for profitability during their early stages, their investors and management teams do focus on adoption: how many people or businesses are implementing the firm’s new product or technology. Sales data can provide useful information on the speed and stage of this adoption.
For example, by looking at total sales and sales growth, one can estimate where a product may be on the adoption curve. If total sales are low, but growth is very high, it is likely in the earlier stages of adoption than if total sales are large, but growth is flattening.
PEG Ratio
But how does one know what a ‘fair’ price-to-sales ratio is for a high growth firm? One method to analyze these figures is to divide price-to-sales by 12 month forward expected sales growth. This is commonly implemented with the price-to-earnings ratio, which becomes the ‘PEG’ ratio when divided by growth. When dividing price-to-sales by growth (PSG), one can get a better sense of not just how much they are paying for each unit of sales, but how much they are paying for future sales growth.
All else equal, a firm with the same price-to-sales ratio, but higher growth expectations, would have a lower PSG than a firm with lower growth expectations, making it more attractive from a growth-adjusted valuation standpoint. A modified version of this approach is to use enterprise value (EV), rather than price (P) in the ratio, which takes into account a company’s debt, punishing those with high leverage.
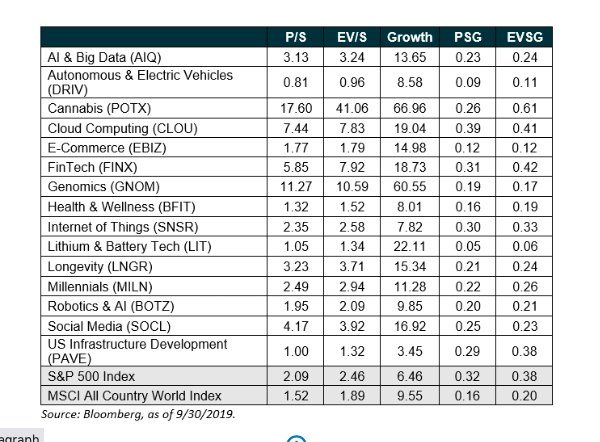
As depicted in the table above, there can be a wide range for PSG or EVSG values across themes. While a low PSG number may imply that a theme is relatively inexpensive compared to its growth prospects, other factors can play an important role in determining near term returns, such as changes in sentiment, risk, and geographic and sector tilts, among others.
Projecting Growth
While price is known, and sales is a relatively straight forward accounting statistic, predicting future growth can be a challenge. Data providers, like Bloomberg, aggregate wall street analyst expectations to publish a single expected growth estimate, which is what is shown in the table above.
These data points can be useful as it effectively crowd-sources growth expectations from a variety of analysts, each incorporating their own projection methods.
However, many foreign and small cap stocks may not have adequate, or any, analyst coverage and therefore growth forecasts. Further, analysts can often anchor their growth expectations based on other analyst reports or previous sales figures.
Takeaway
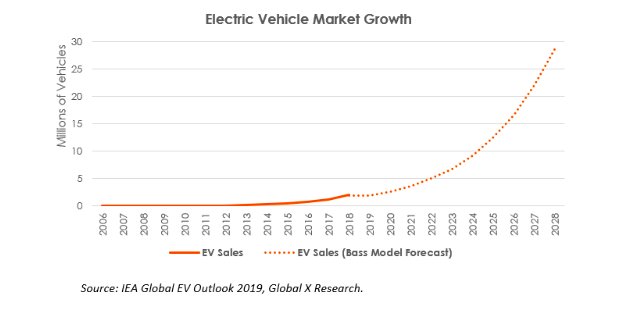
Given these obstacles, some investors may take it upon themselves to craft their own growth forecasts. One method to project growth is to calculate a technology’s total addressable market (TAM) and to analyze how much of that market has already been penetrated.
For example, a very basic calculation would show that the 2 million electric cars sold in 2018 represents 2.9% of the total 68.7 million cars sold that year.(2) Using techniques like linear extrapolation or a Bass Diffusion Model can help analyze how quickly the remaining addressable market could be penetrated. More sophisticated models would incorporate other considerations as well, such as changing demographics, the impact of ride-sharing, and the potential for alternative forms of transformation. If analyzing individual companies, one must also consider their change in market share, as early market leaders often lose market share as competitors catch up.
When looking at a basket of stocks that is representative of an entire industry however, this step is less necessary as changes in market share are zero-sum among the peer group in the basket.
Conclusion
Disruptive companies tend to look expensive on traditional valuation metrics compared to slower growth areas of the stock market. But investors in high growth firms are not paying a premium because they value today’s earnings; they are future-focused, caring about the economic potential several years from now.
As such, we believe considering trends in sales, adoption, and future growth are more relevant to valuing disruptive companies in the early stages than more traditional metrics like earnings.
This article was first published on the Global X research blog on October 9 .
Reference Shelf
1. The missing FAANG from the Top 5% is Apple, which ranked 143rd in the S&P 500 by expected sales growth (top 30%).
2. International Organization of Motor Vehicle Manufacturers, 2019.
Photo Credit: Zooey via Flickr Creative Commons
Disclosure:
Investing involves risk, including the possible loss of principal. International investments may involve risk of capital loss from unfavorable fluctuation in currency values, from differences in generally accepted accounting principles, or from economic or political instability in other nations. Emerging markets involve heightened risks related to the same factors as well as increased volatility and lower trading volume. Securities focusing on a single country and narrowly focused investments may be subject to higher volatility. CHIQ is non-diversified.
Shares of ETFs are bought and sold at market price (not NAV) and are not individually redeemed from the Fund. Brokerage commissions will reduce returns. Global X NAVs are calculated using prices as of 4:00 PM Eastern Time. The closing price is the Mid-Point between the Bid and Ask price as of the close of exchange. Closing price returns do not represent the returns you would receive if you traded shares at other times. Indices are unmanaged and do not include the effect of fees, expenses or sales charges. One cannot invest directly in an index.
Carefully consider the Fund’s investment objectives, risks, and charges and expenses before investing. This and additional information can be found in the Fund’s summary or full prospectus, which may be obtained by calling 1-888-GX-FUND-1 (1.888.493.8631), or by visiting globalxfunds.com. Please read the prospectus carefully before investing.